About Alan Palazzolo
Alan Palazzolo is an open-source coder trying to make the world a little better using technology to tell compelling, visual, and data-driven stories.
Projects by Alan Palazzolo
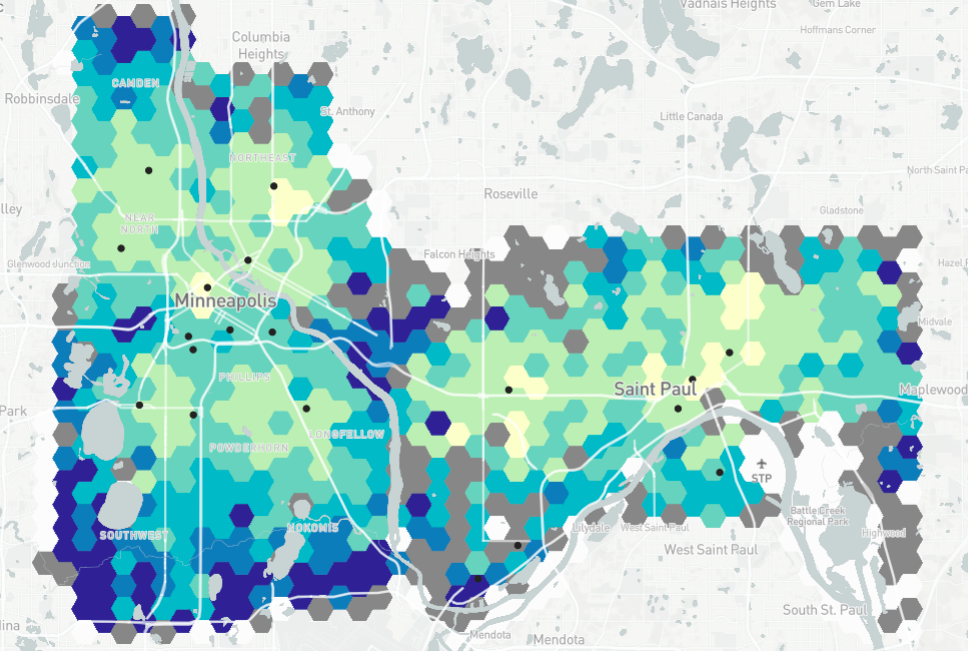
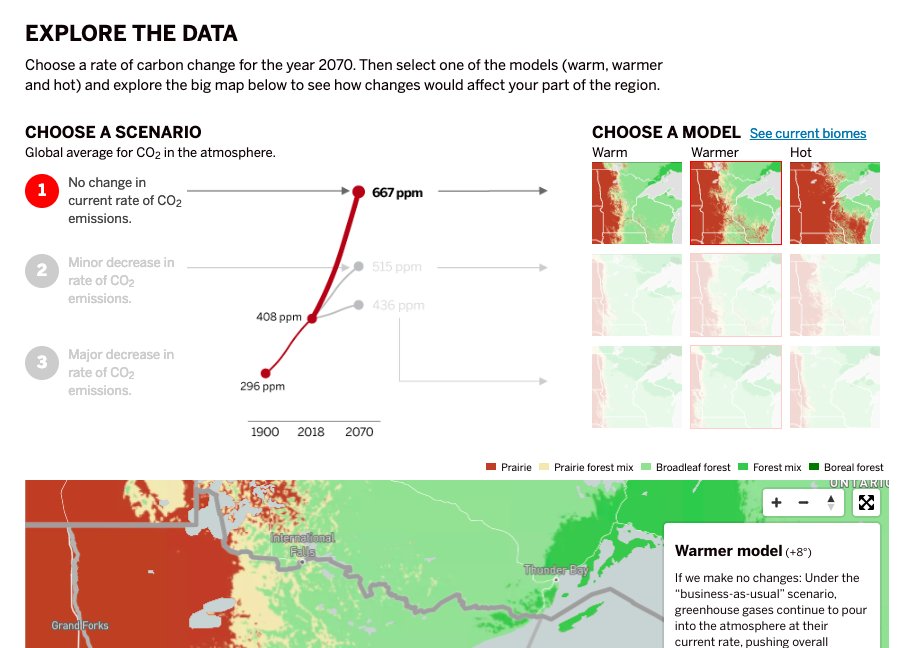
Disappearing forests in Minnesota
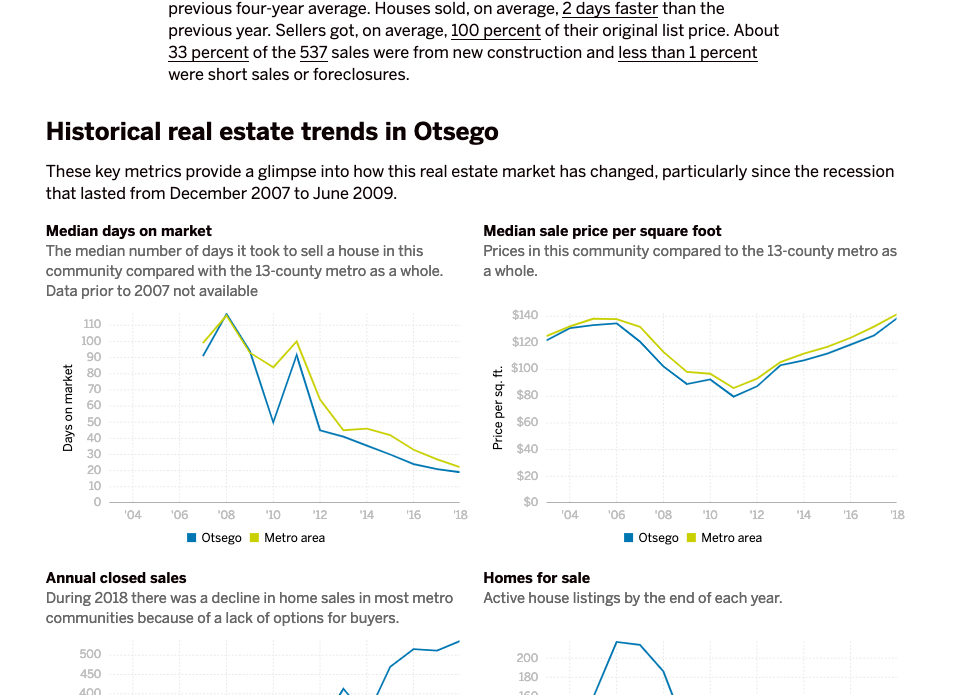
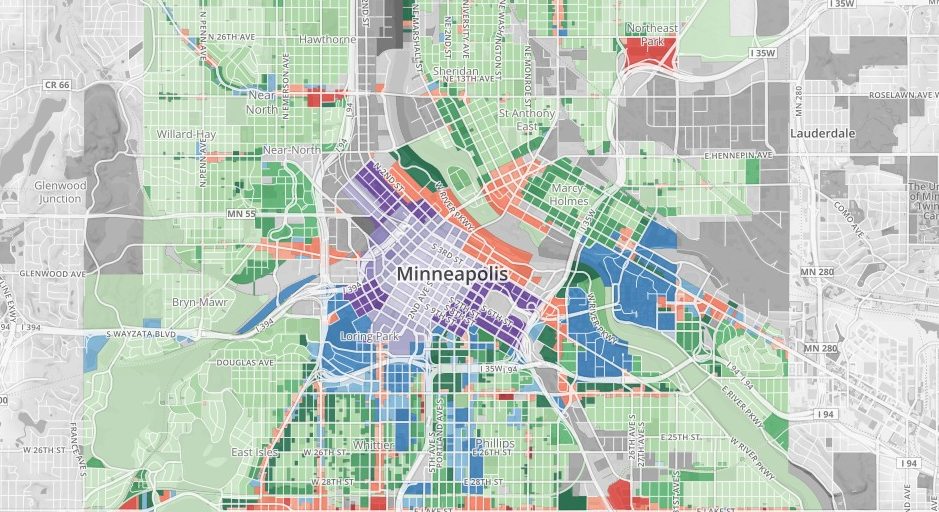
Housing markets in the Twin Cities
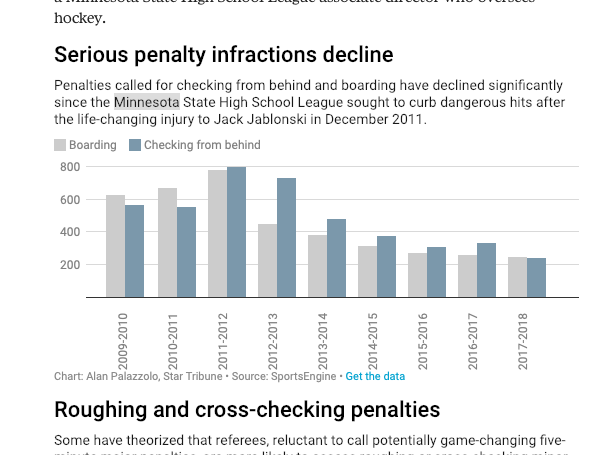
How high school hockey in Minnesota has changed
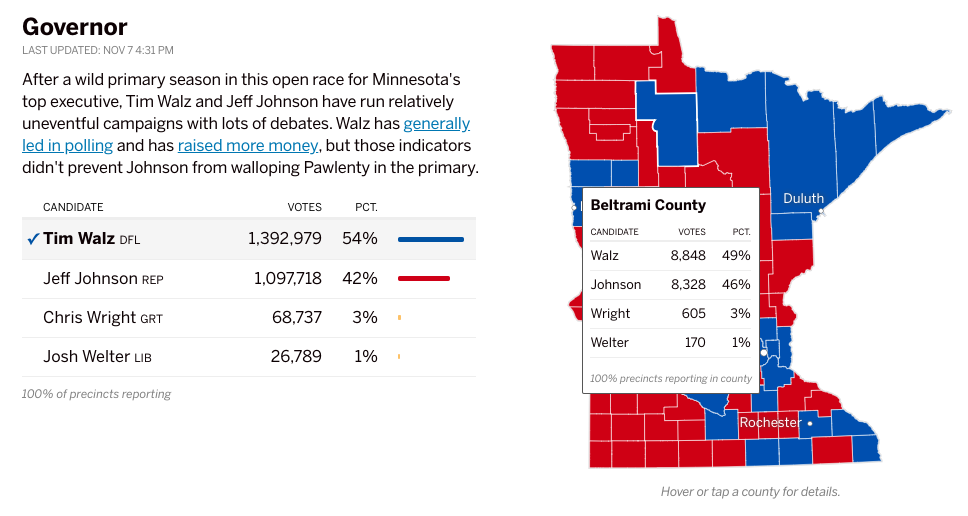
Live midterm election results
Denied Justice

Denied Justice was a powerful, multi-part series about sexual assult in Minnesota; I was tasked with building the front-end of the interactive video installment.
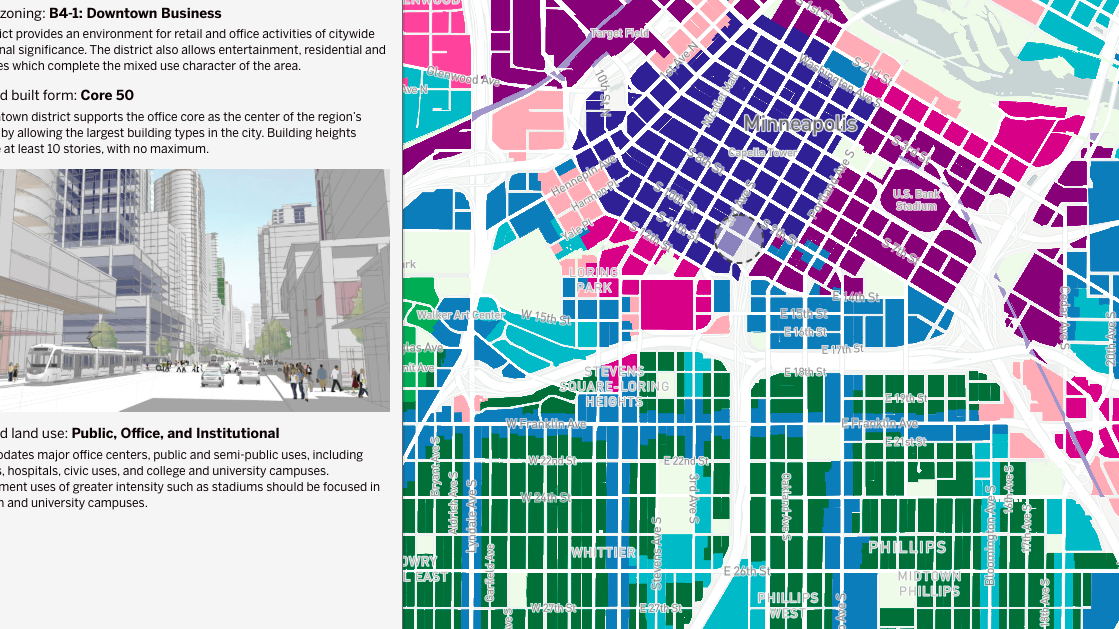
Minneapolis 2040 plan
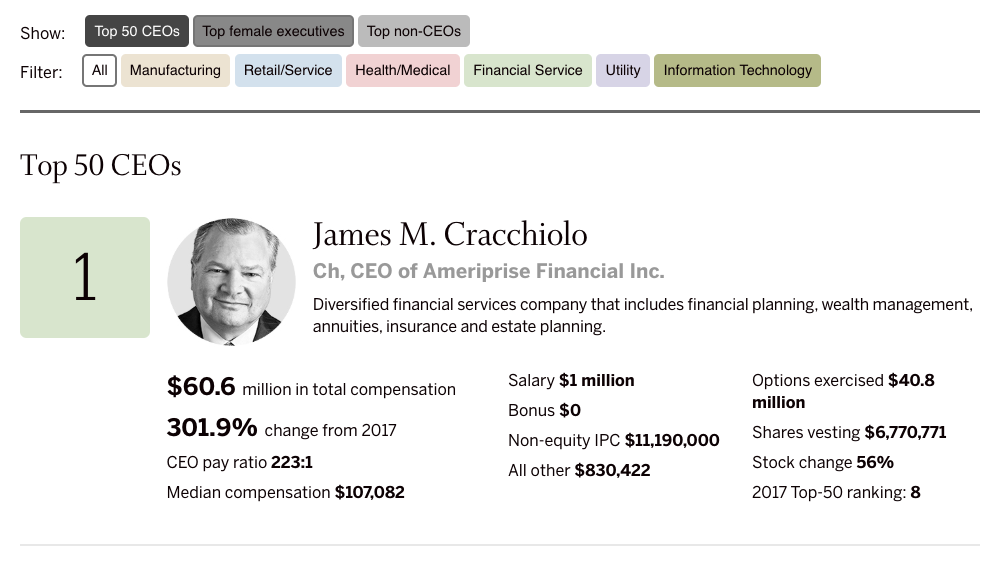
Top executives in Minnesota
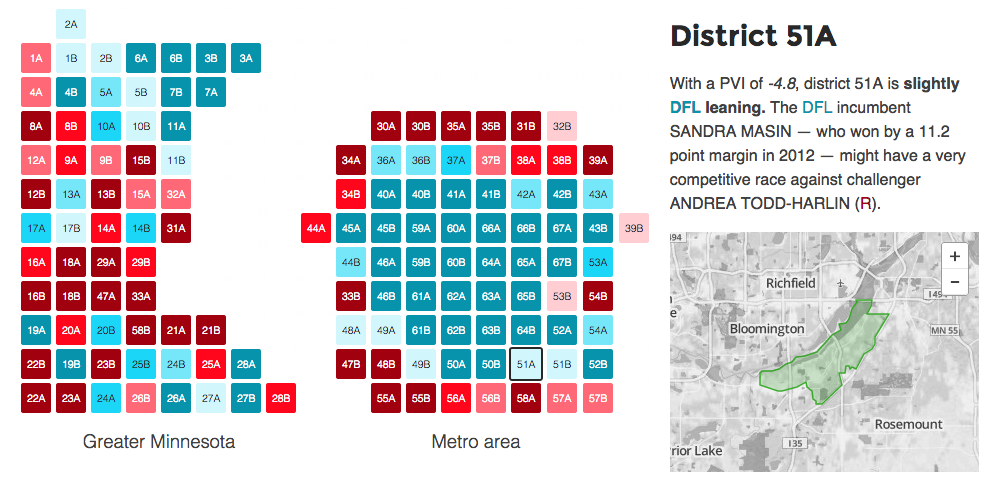
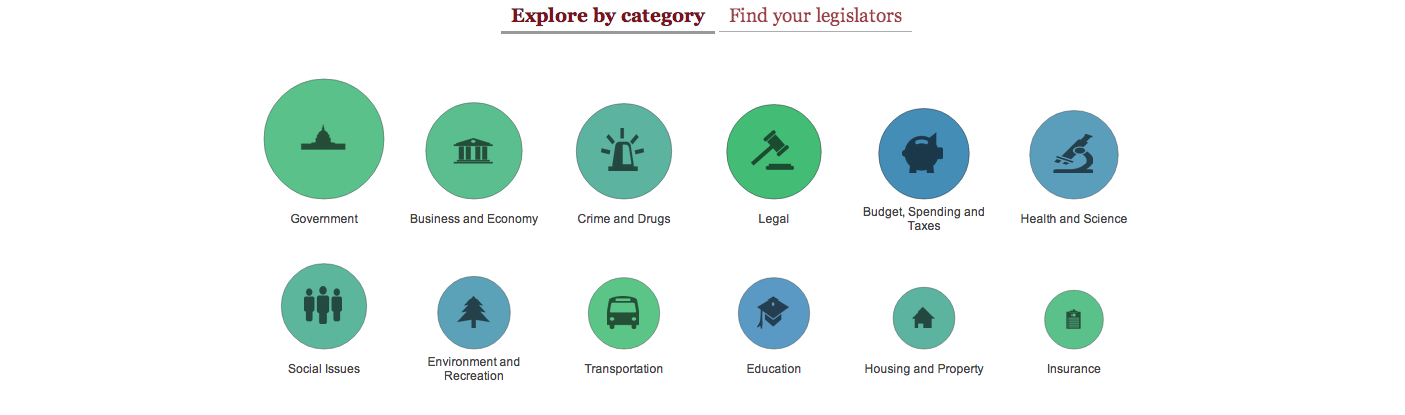
Minnesota election guide

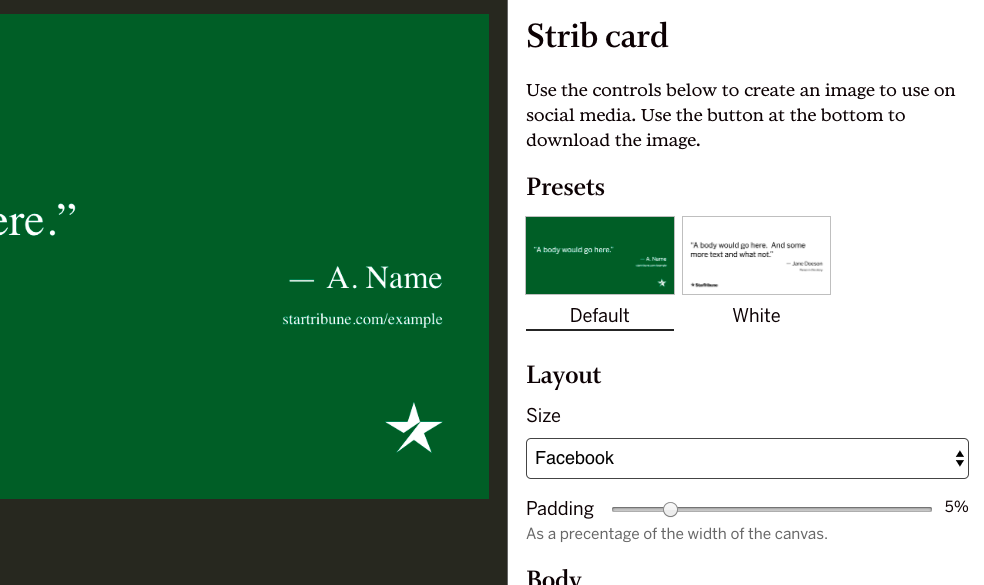
Strib social card generator
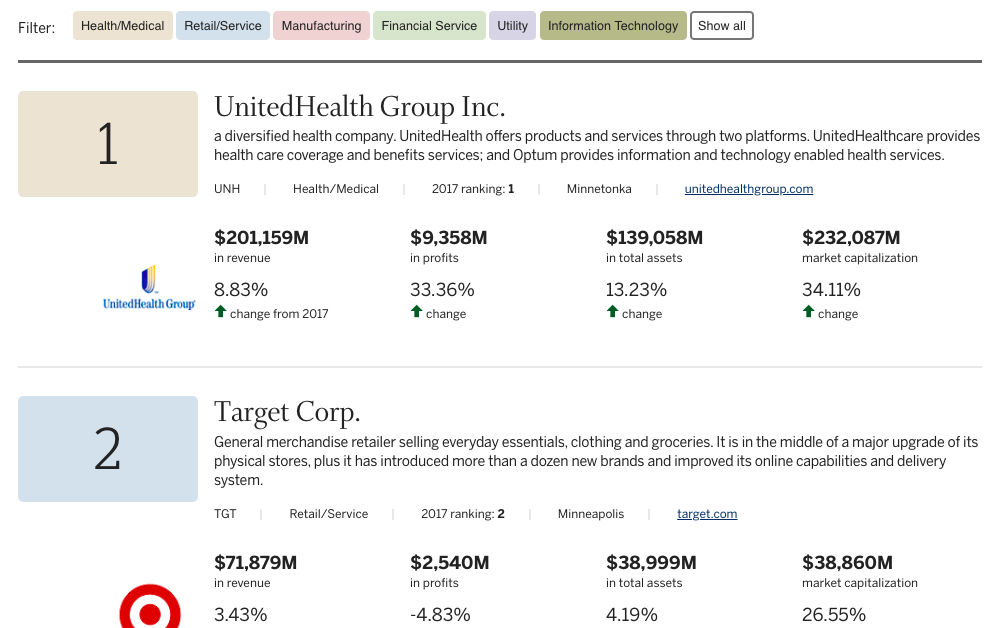
Minnesota top businesses
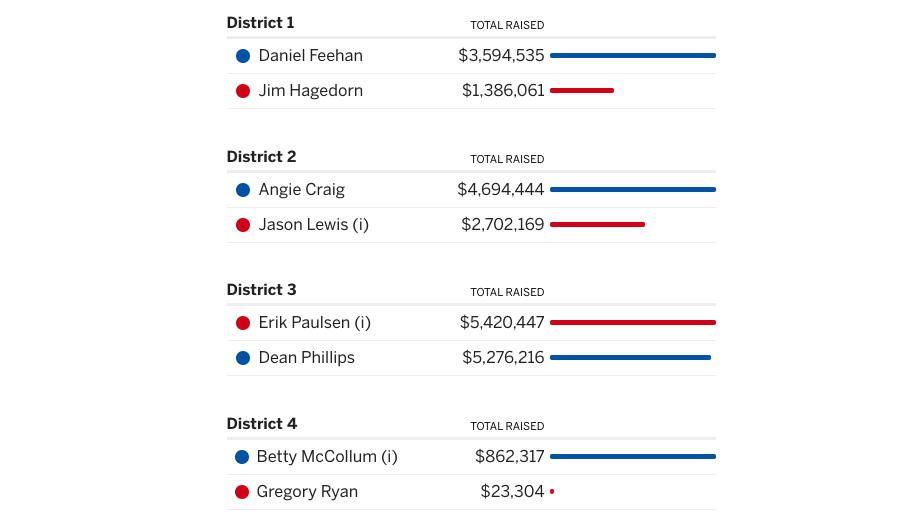
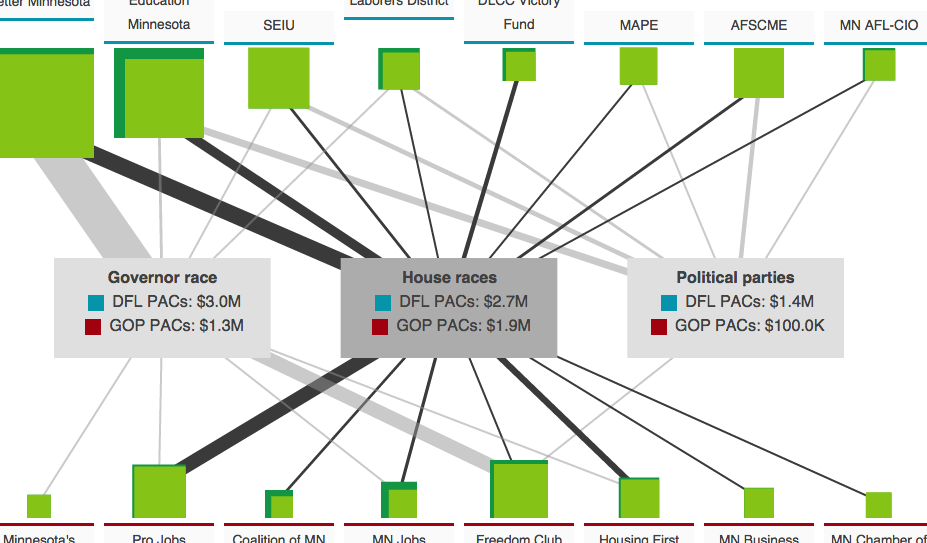
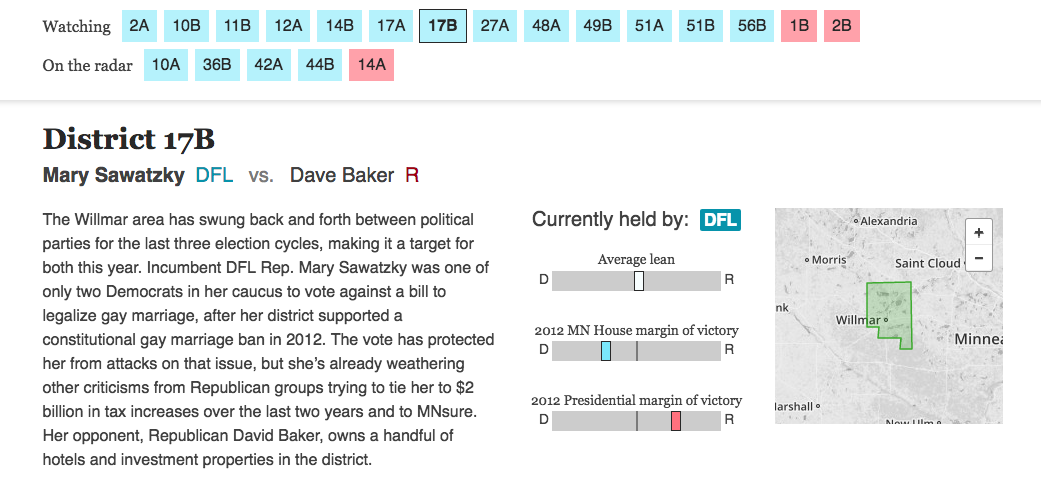
Minnesota campaign finance in key races
Summer camp guide

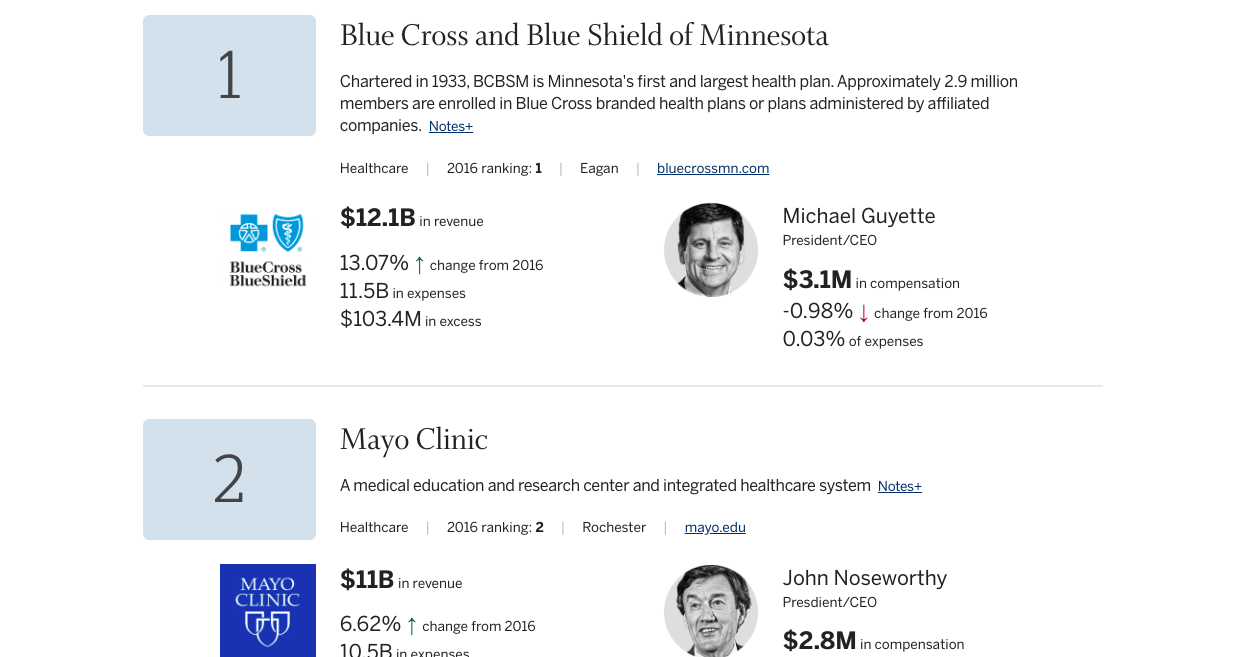
Minnesota top non-profit 100
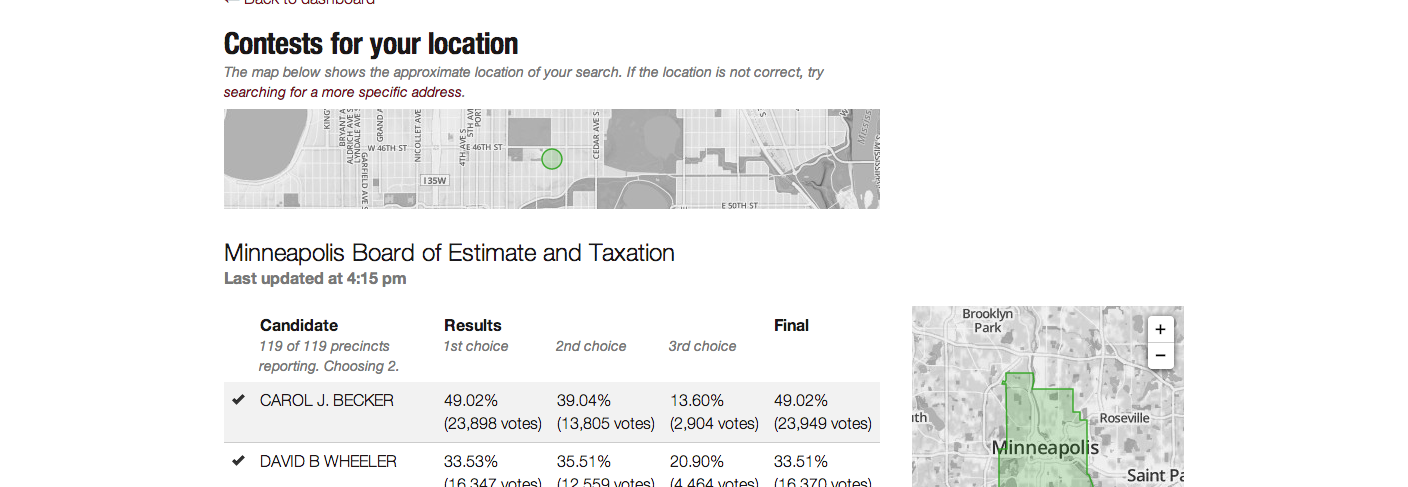
Twin Cities election guide
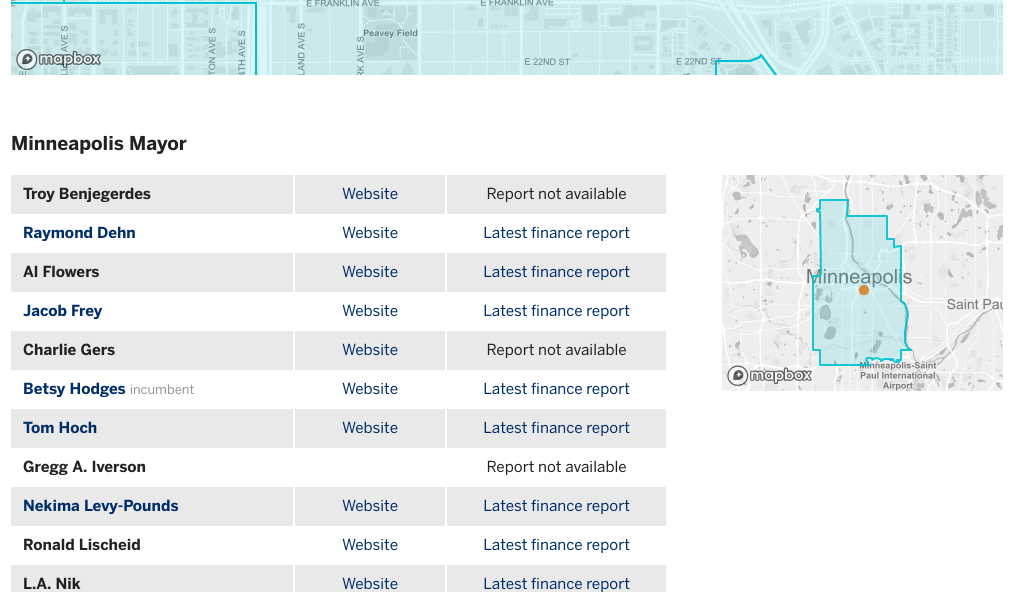
Address-based lookup to figure out what is on the ballot in the Twin Cities.
Super Bowl guide

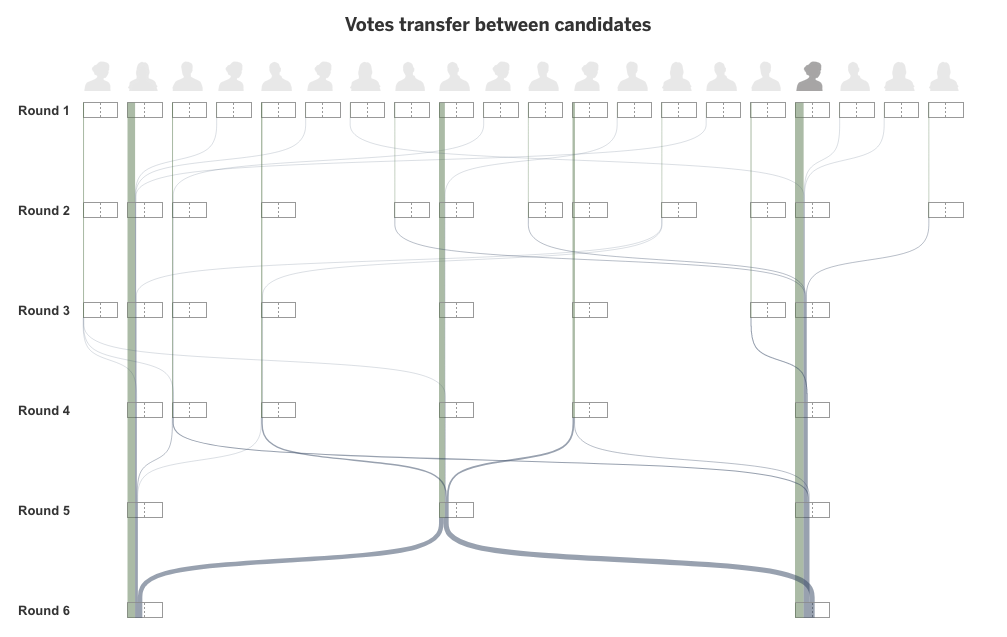
Ranked-choice explained
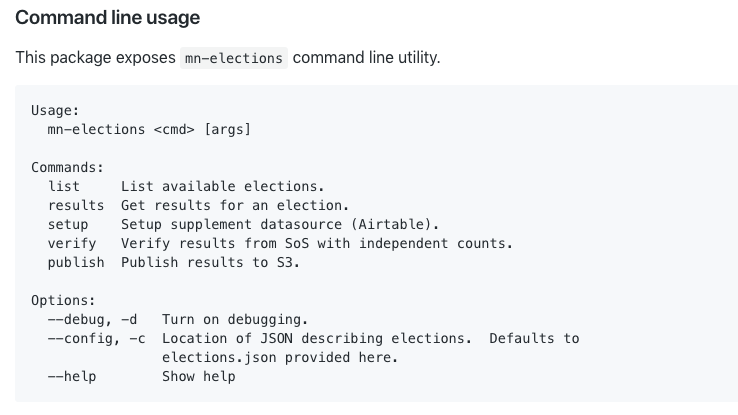
Minnesota elections API
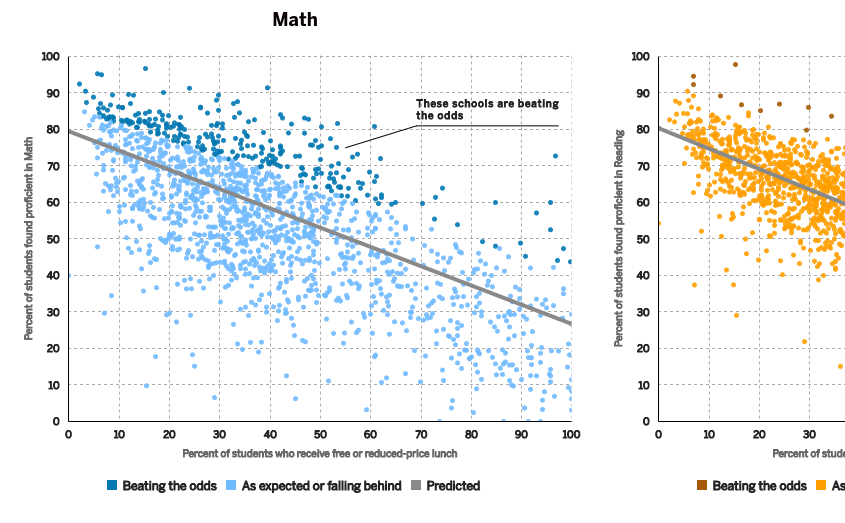
Beating the odds
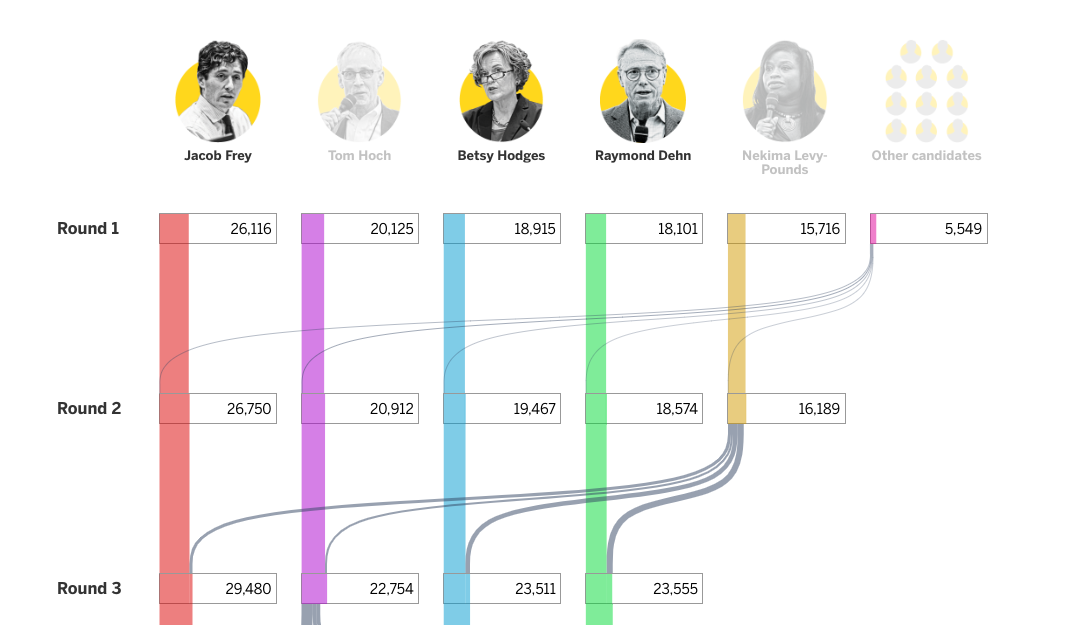
Mayoral calculus
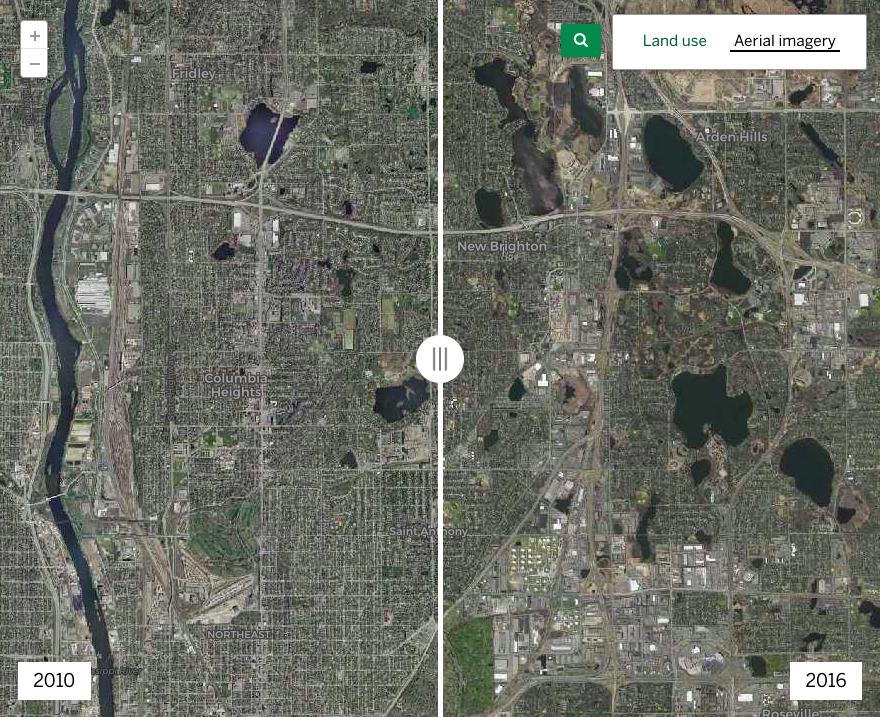
How land use has changed in the Twin Cities
Town halls
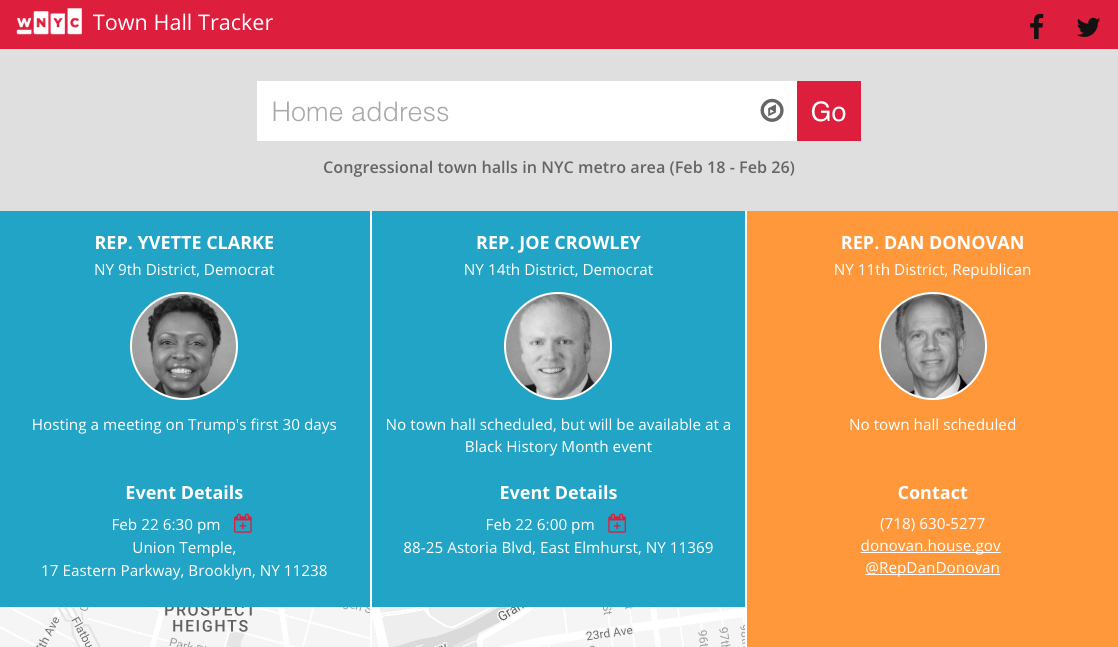
During the 2017 congressional recess, we tracked which representatives were having town hall meetings.
Where they stand
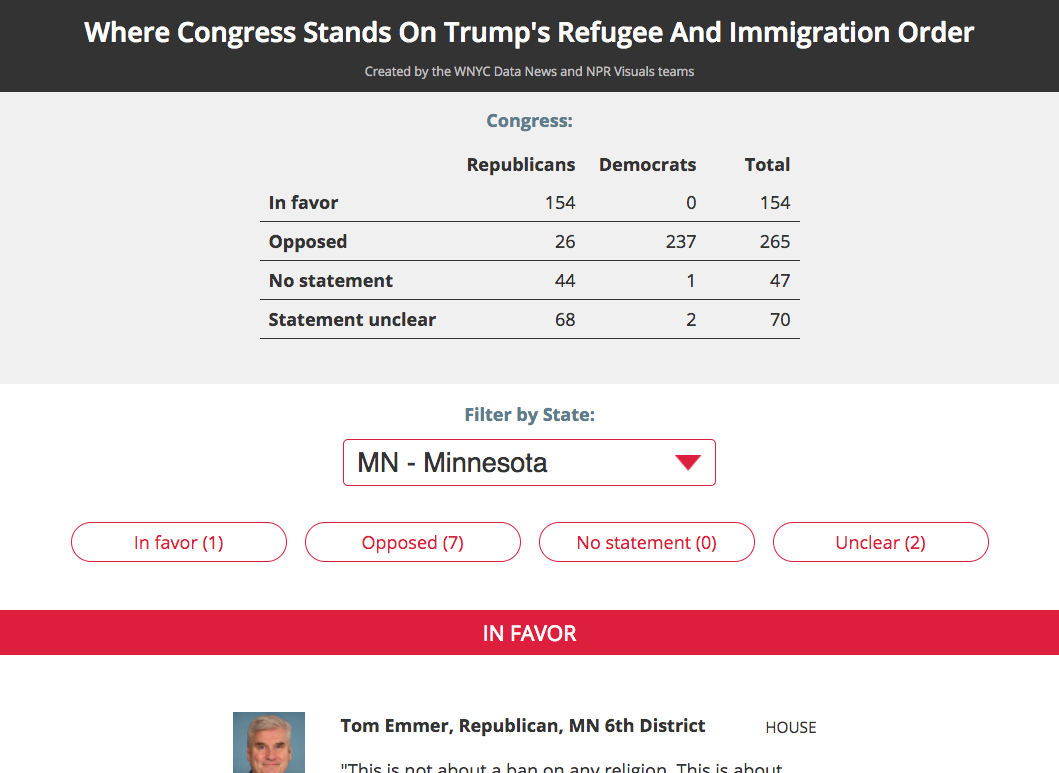
Working with reporters and devs at WNYC and NPR, we quickly surveyed all members of Congress on their stance concerning the travel ban, and created a simple interface to look up your representatives.
Harlem Heat
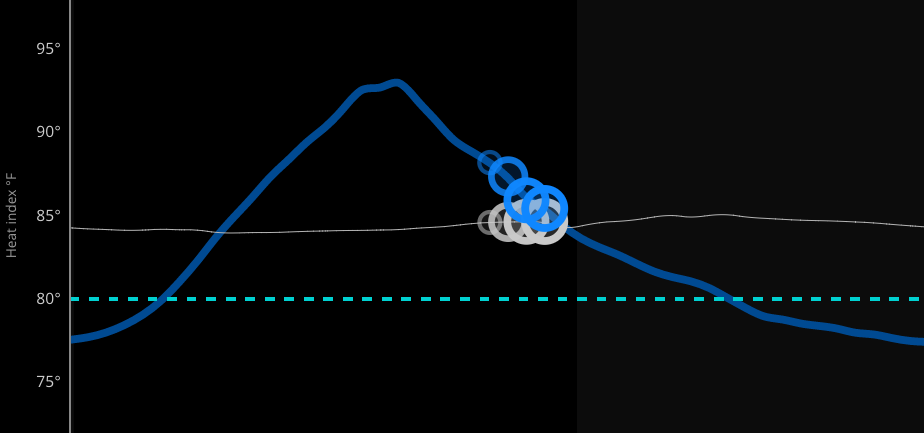
As part of the Harlem Heat multi-part series the data team created sensors to monitor the indoor temperature in Harlem that worked to inform reporting as well as data visualiztions and "audio-izations".
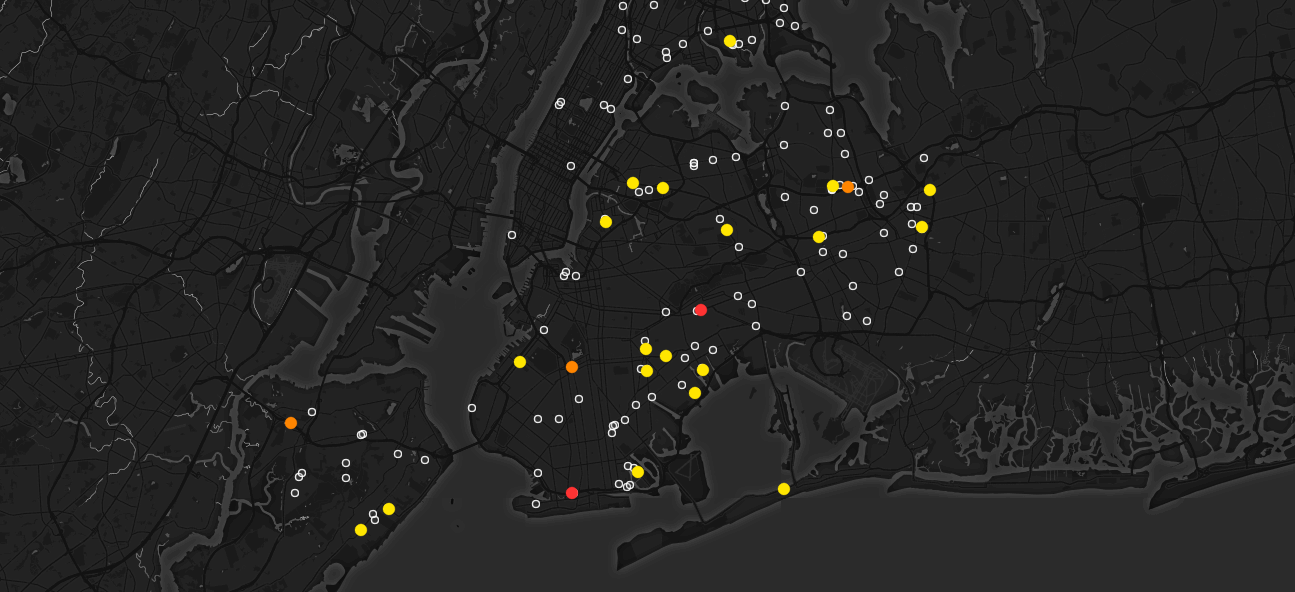
Landslide
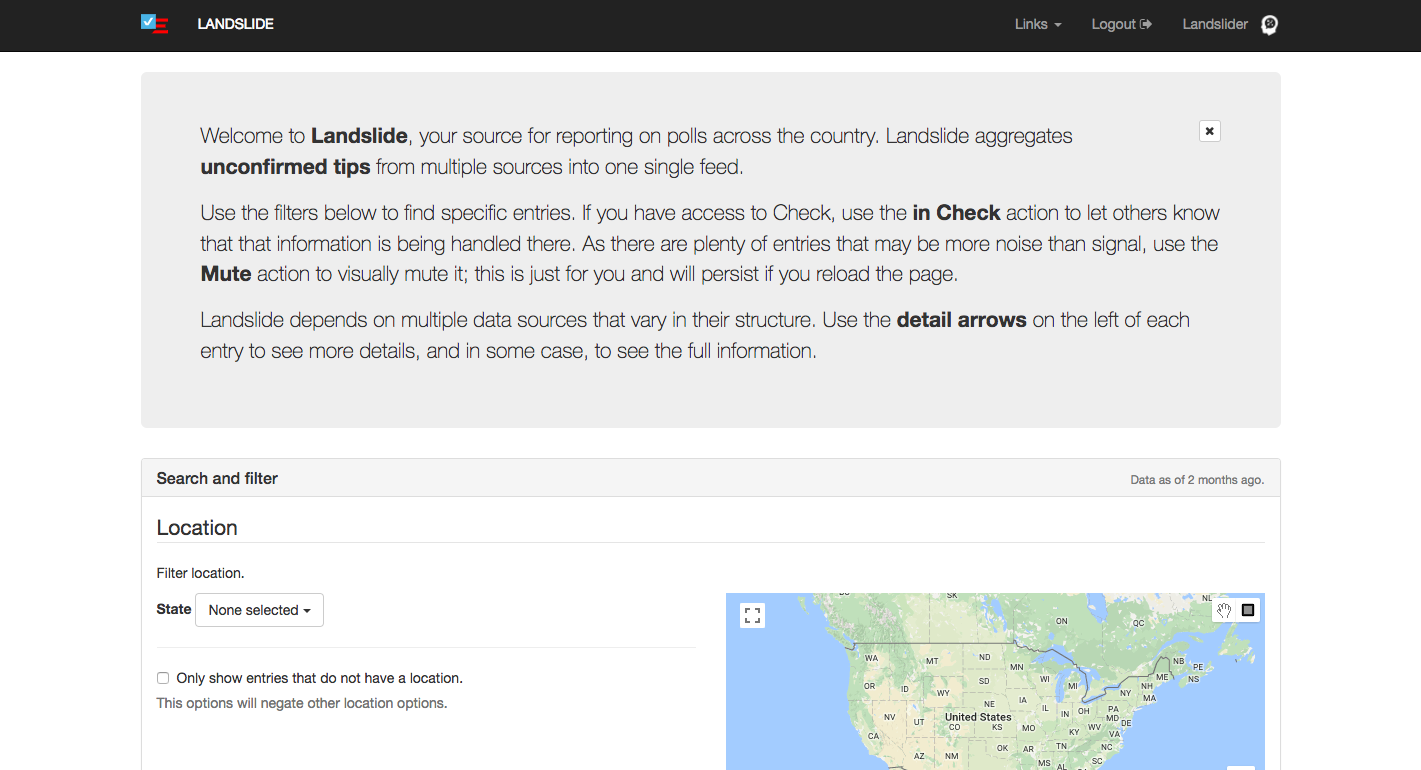
For Electionland 2016, I created a small, lightweight interface to explore the firehose of multiple data sources that ElectionLand was gathering information from; this helped the volunteers and reports to triage quickly and get to the most relevant data they needed more efficiently.
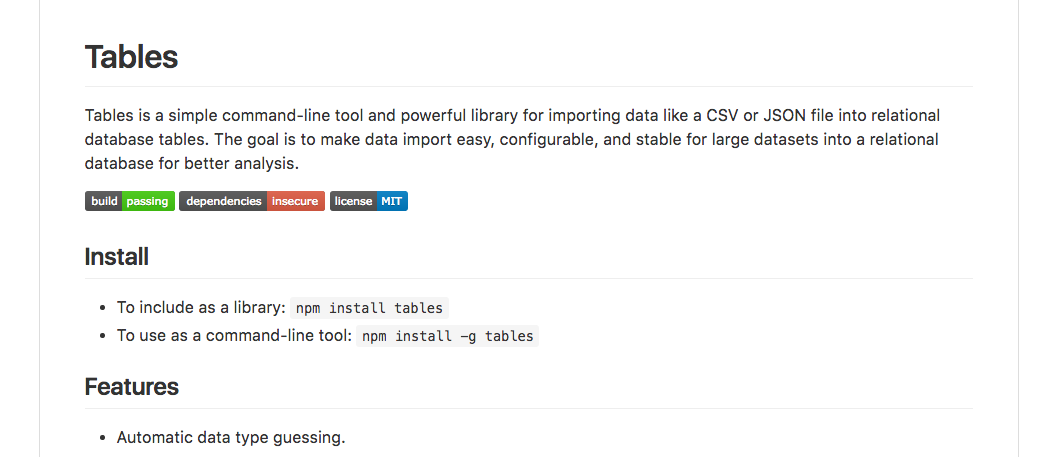
tables
catalog-it
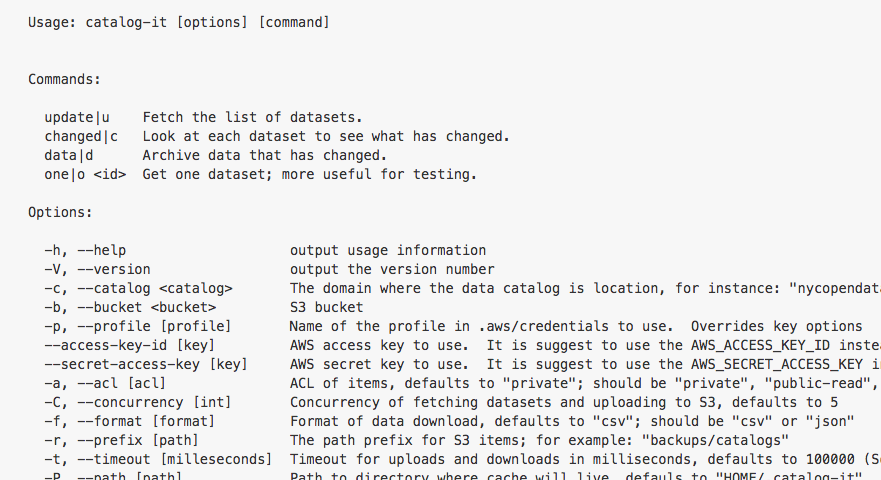
A command line utility, catalog-it provides functions to archive data catalogs. By using something like cron, catalog-it can watch and download and archive every dataset in a data-catalog when it changes, such as New York City's data portal. Currently only works with Socrata data portals.
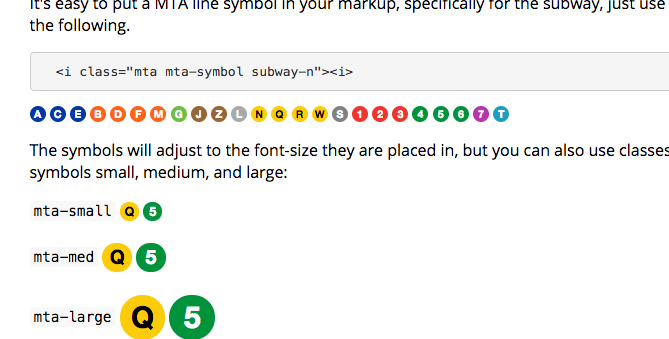
MTA styles
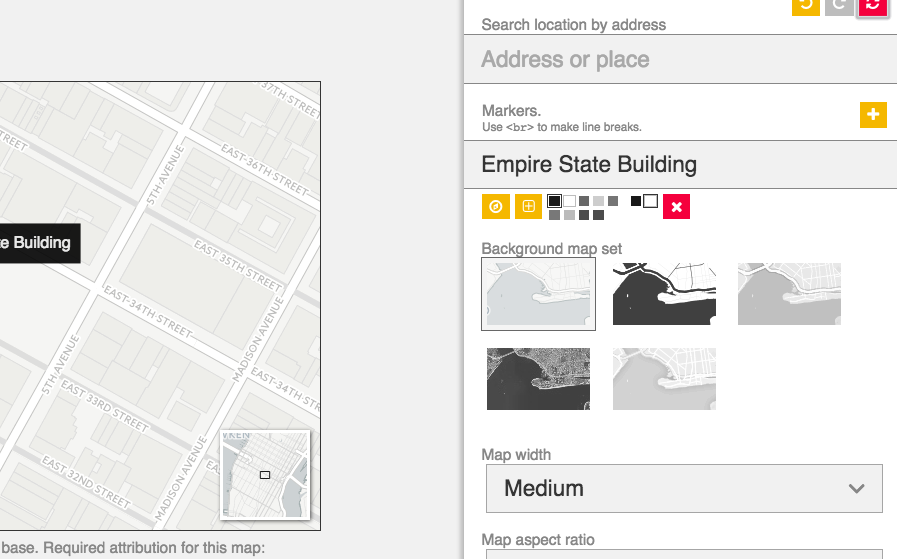
Locator
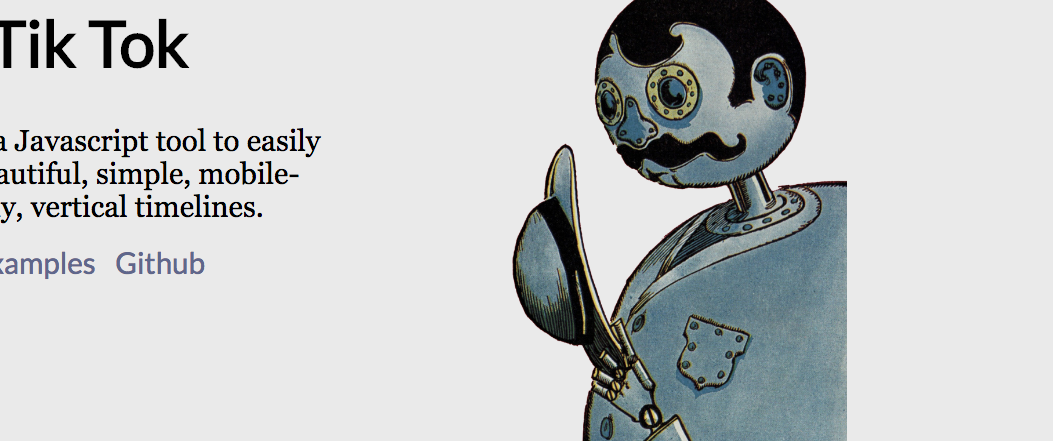
Tik Tok
Section 8
Working with reporters we analyzed and presented data that showed how those with housing choice vouchers were more likely to live in high poverty areas as well as mapping to show the growth and concentration of vouhcers.
Infomagical
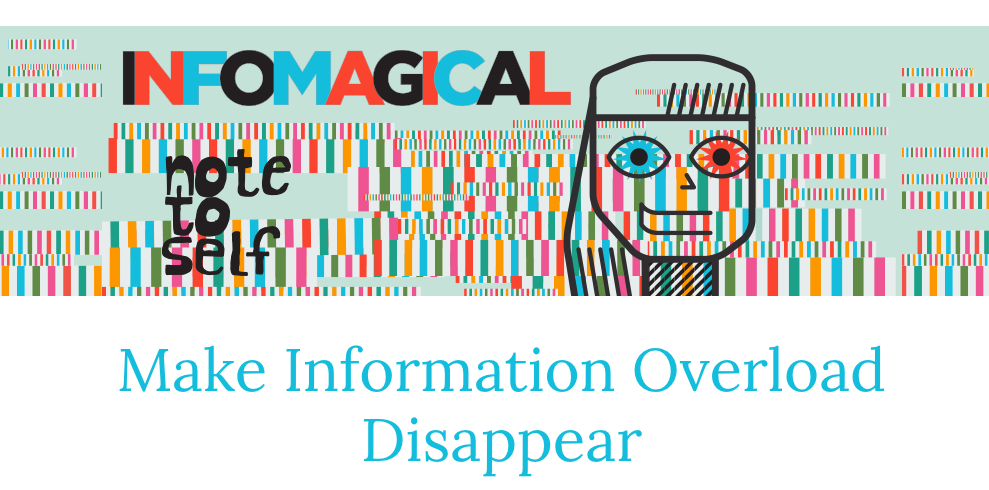
As part of Infomagical, an engagement project around information overload, I built a back-end SMS system that interacted with 20k users and sent over 100k messages and images, all on a very tight deadline.
NJ toxic sites
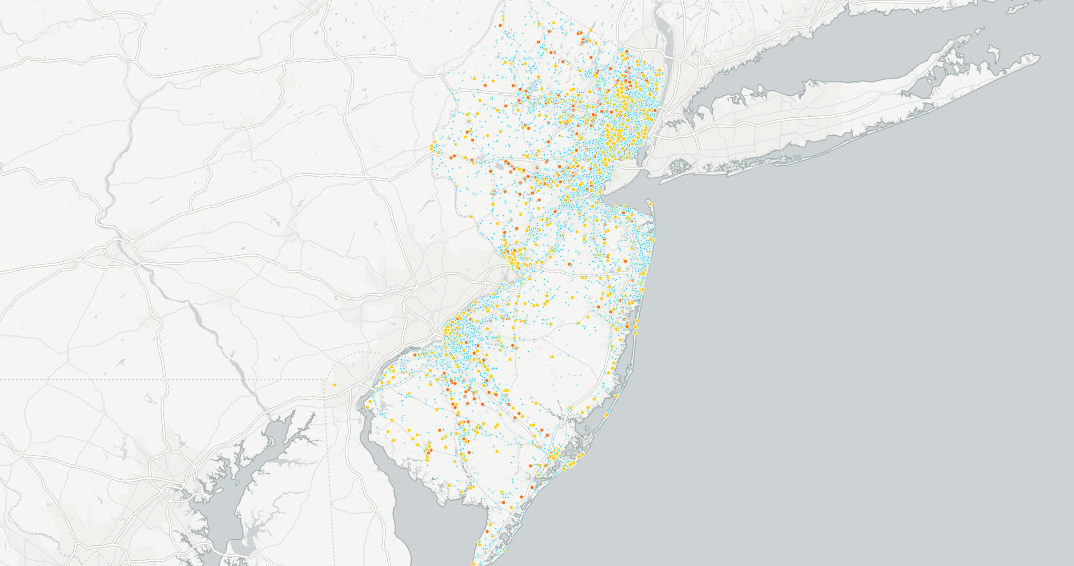
After recieving information on every "contaminated site" within NJ, we analyzes who lived closest to these sites, and allowed listeners to find sites near where they lived or cared about.
Aurora Shanty

As part of the 2016 Art Shanty project, I led a team that built a northern-lights-inspired, solar-powered LED display inside a small shanty on a frozen lake for a month in the Minnesota winter.
Schoolbook

In 2016, we updated the popular SchoolBook website that provided an interface to easily search and compare schools in NYC.
Citi Bike deserts
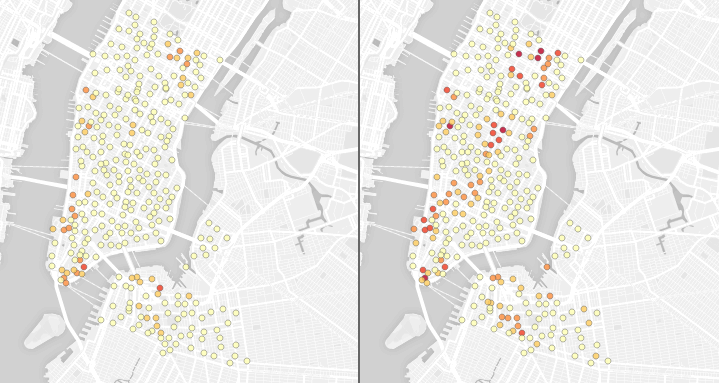
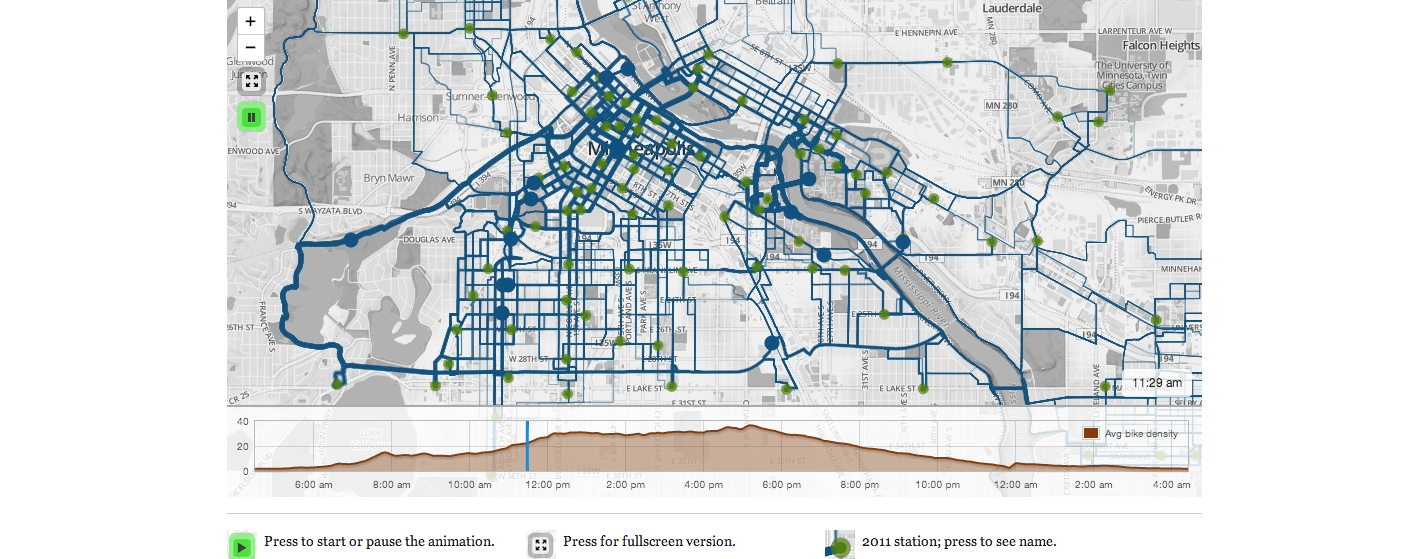
After tracking data from the hundreds of Citi Bike stations, we were able to determine when and where there was consistent empty or full areas around the city.
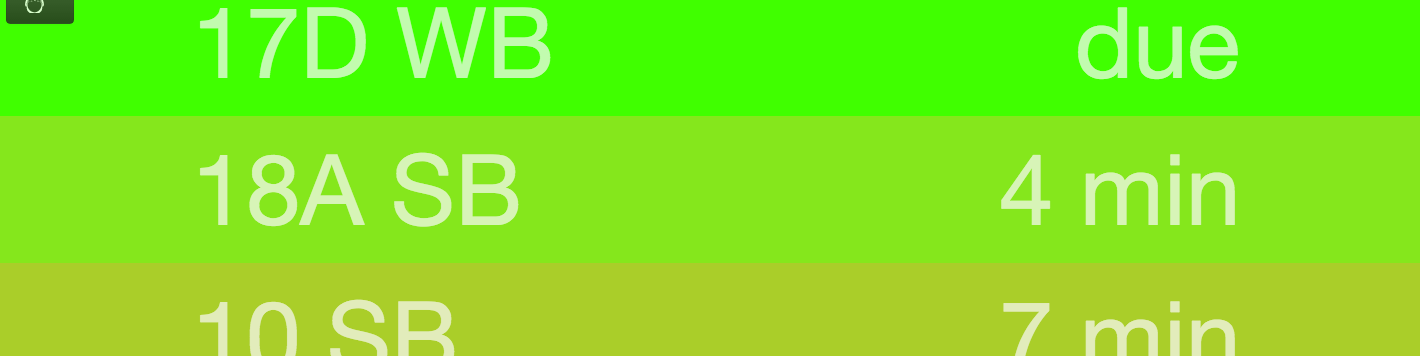
Kittenbus
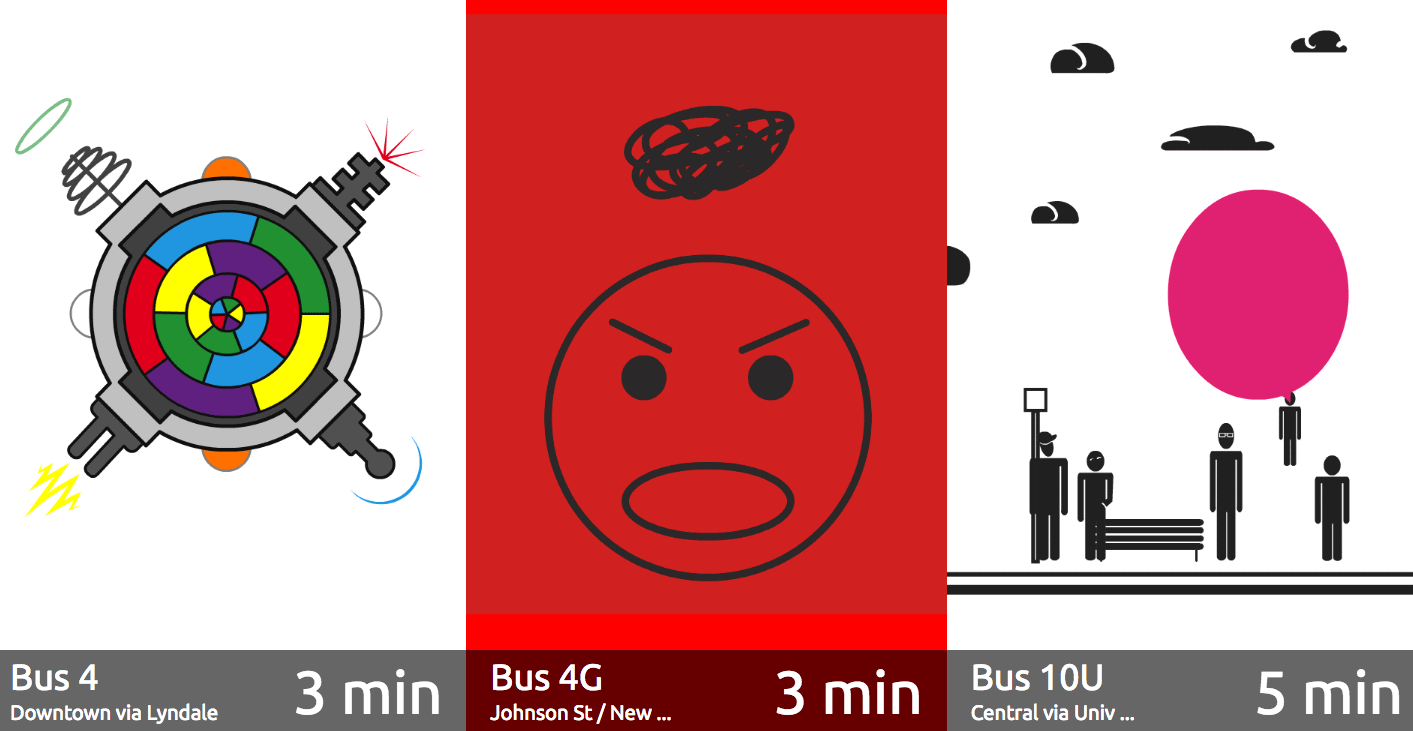
Working with young artists at Juxstaposition Arts, we created and installed a display near a downtown bus stop in Minneapolis, that showed custom, animated visualizations of buses arriving in real-time.
Pope visit
In 2015, Pope Francis visited New York City, so we turned the word-heavy advisory that the City provided into a map of what and when roads were closed during the visit to help commuters better plan.
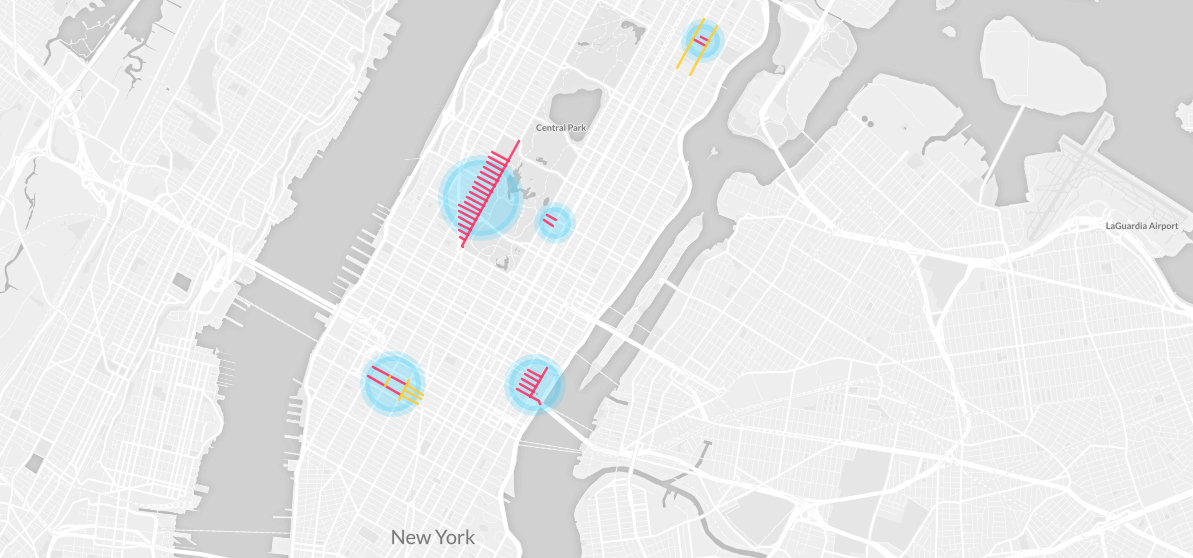
Bike lane blockers
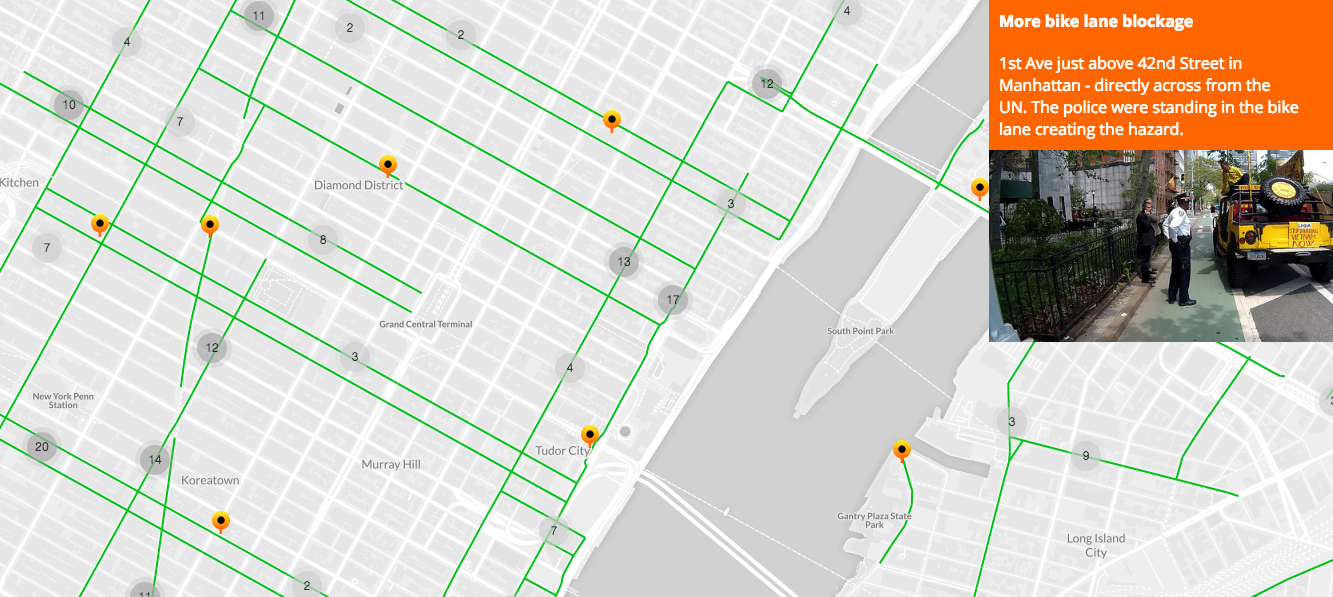
Asking listeners to submit their experiences and pictures, we created a map showing where cars, trucks, people, and may other things ended up blocking the bike lanes.
Metal detectors
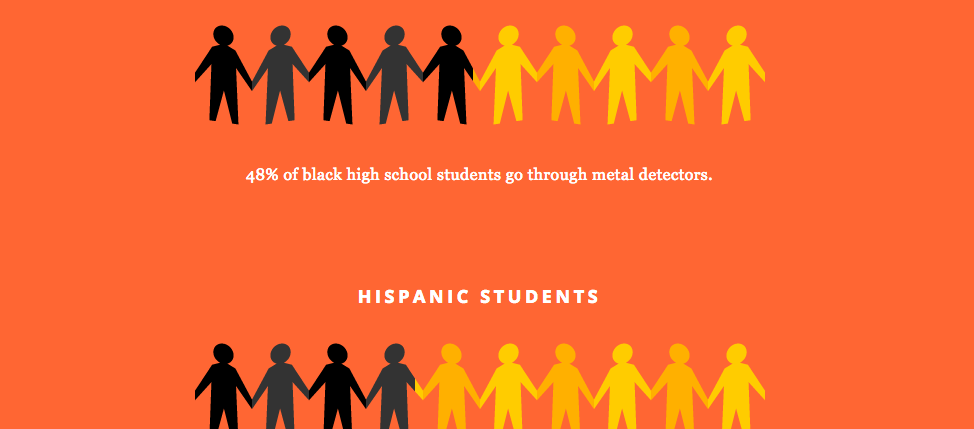
Manually piecing together multiple datasets, we analyzed the schools that had metal detectors and what kind of students ended up going through them.
Illegal hotels
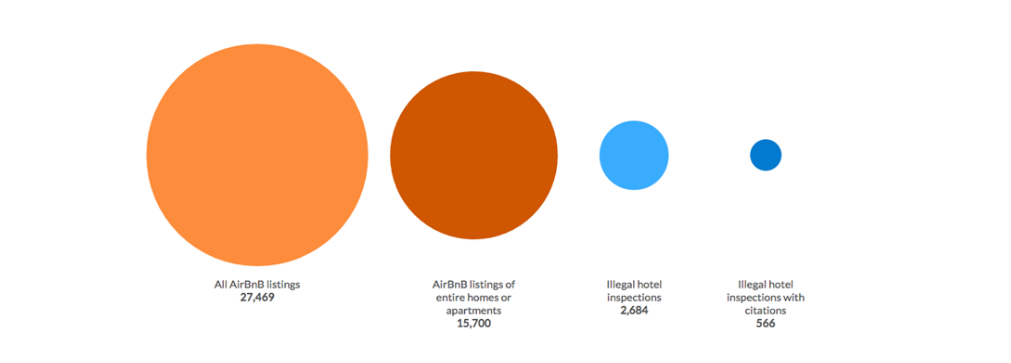
We did geospatial analysis of AirBnB listings and inpsections of "illegal hotels" in NYC.
Parks access
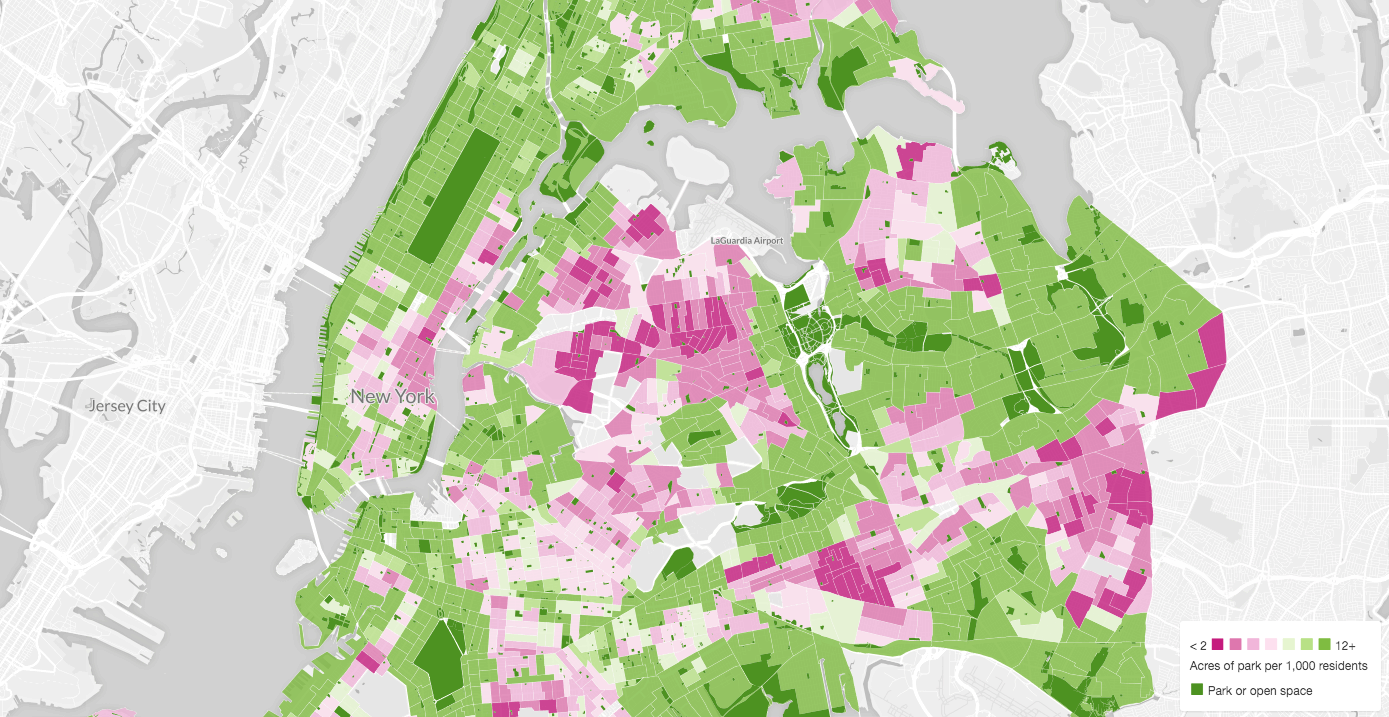
We analyzed parks and park access across NYC and found that though the numbers in aggregate are good, access could vary greatly across the city.
Determined Dill
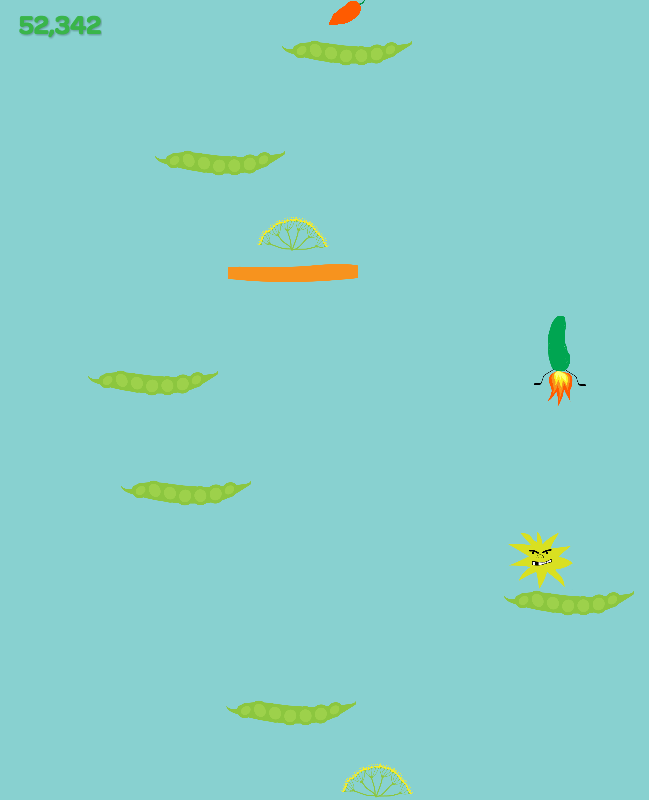
As part of the first Minnesota Pickle Festival, I created this simple, browser jumper game in collaboration with Squawk.
NYC stock photos
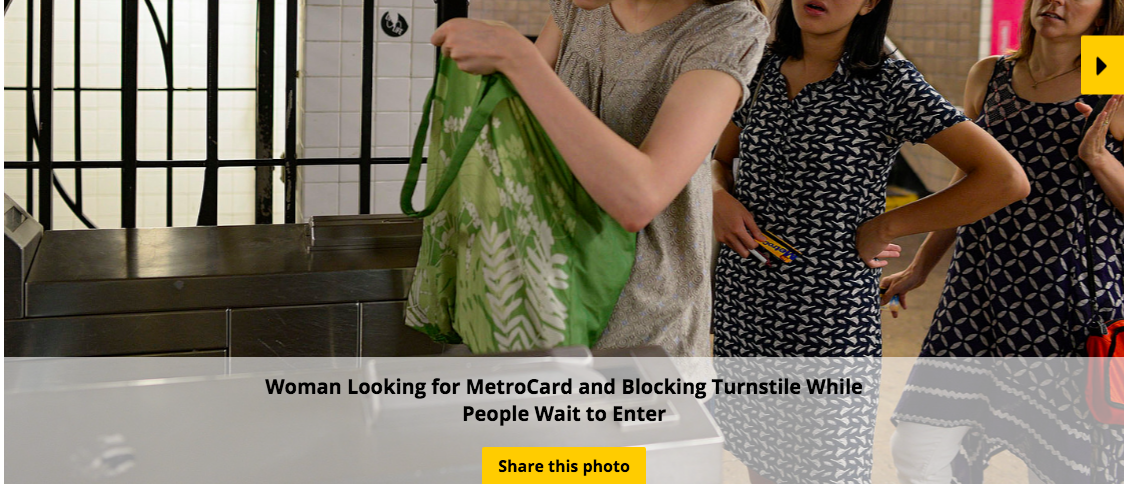
Our team went out into the city and acted out typical situations one comes across in NYC; we then released the photos under a Creative Commons license on Flickr.
Ice cream radar
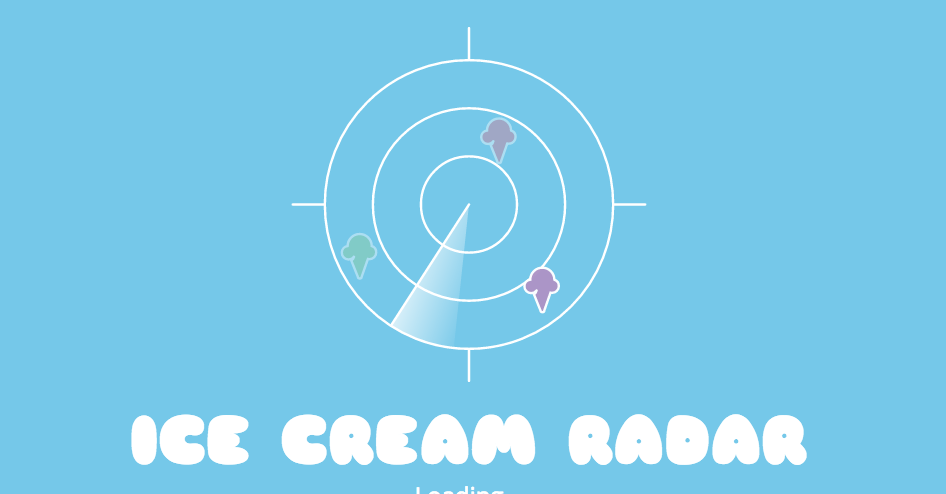
It was hot in NYC, so we made a map to help people to get to ice cream.
Subway agony
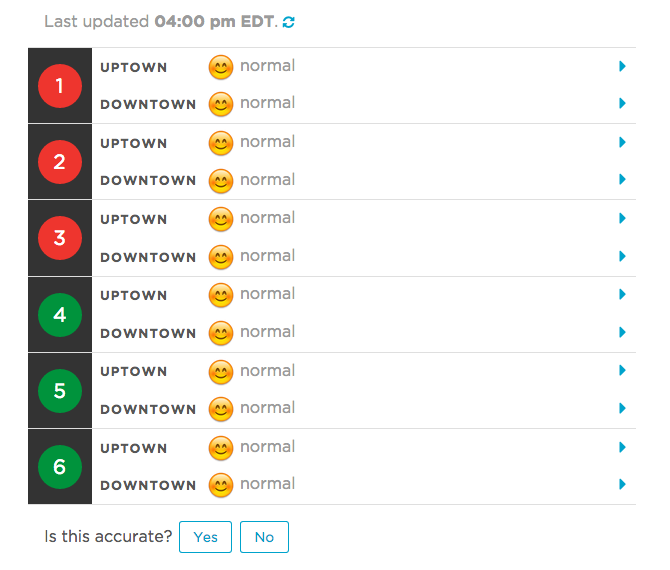
To help determine just how late trains were running across the MTA system, we regulary took snapshots of real-time train data to create the simplified, emoji-based "Subway Agony index".
NYC watershed
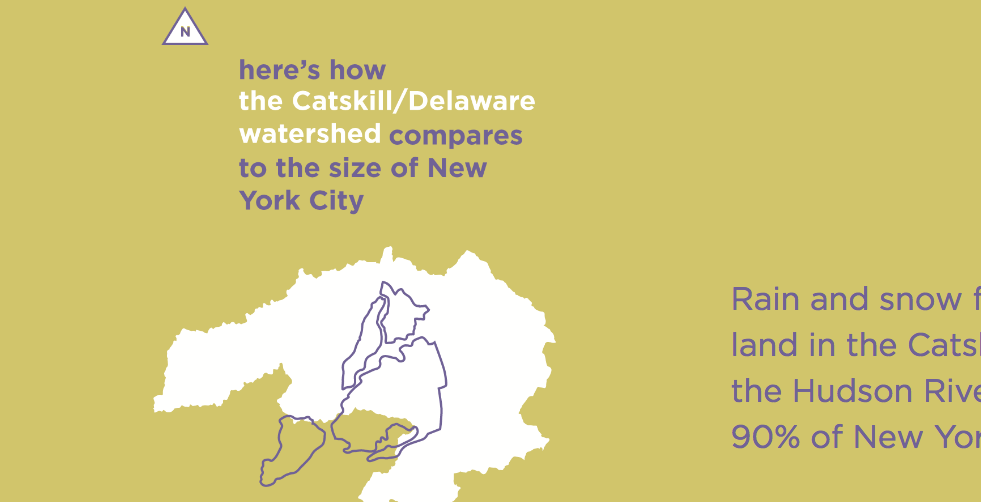
A visual explanaition of where NYC gets most of it's drinking water from.
Christieverse
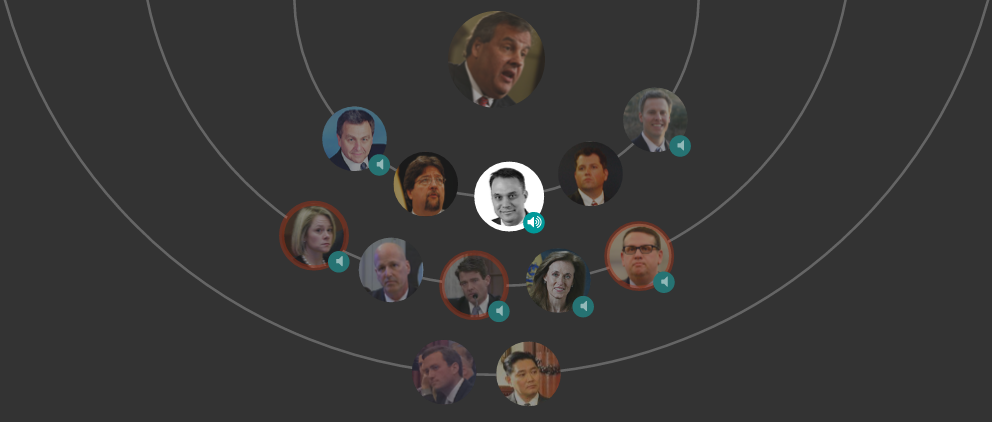
In the wake of the George Washington Bridge lane closure, a.k.a. Bridgegate, we created an audio and visual walk through of the people involved and their relation to Governor Chris Christie.
Slack-enabled camera
An experiment in connecting Slack to a camera to help facilite remote work.
Speed cameras
After analyzing ticket locations across the city, our team could pinpoint where speeding cameras were and what kind of impact they had.
Outside spending
MN competitive House districts
Minneapolis zoning
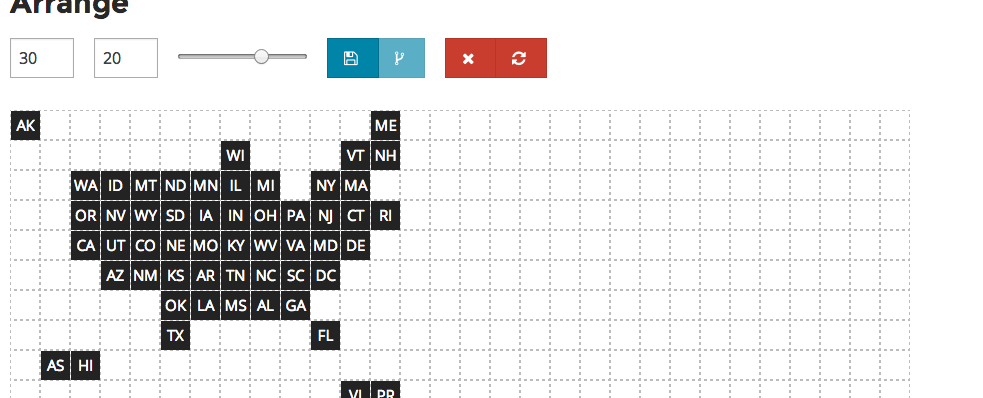
aRanger
20 races
Lacu
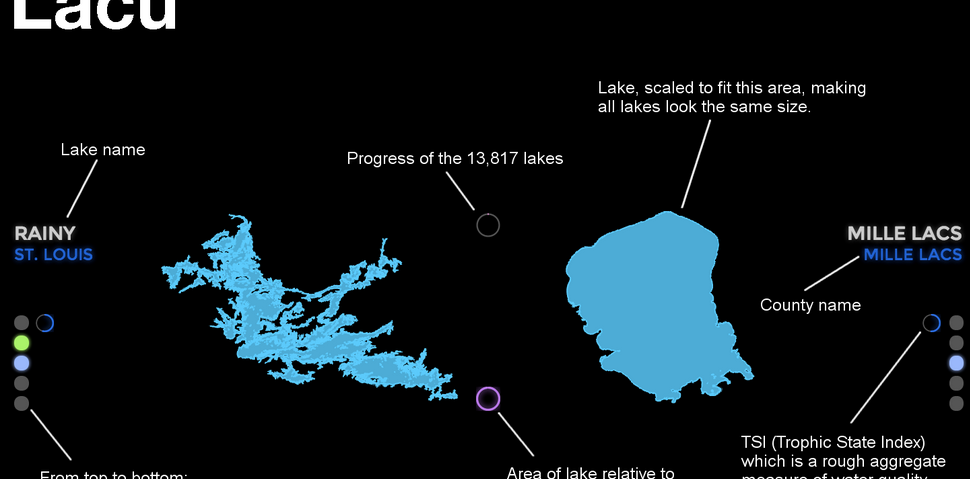
Lacu is a project we made for Northern Spark 2014 which visualizes 13,817 lakes in Minnesota, two at a time. Lacu ran from sun up to sun down, the span of the event. The plan was to project it on the front of the Northrup Auditorium, but due to weather, we projected it inside the building.
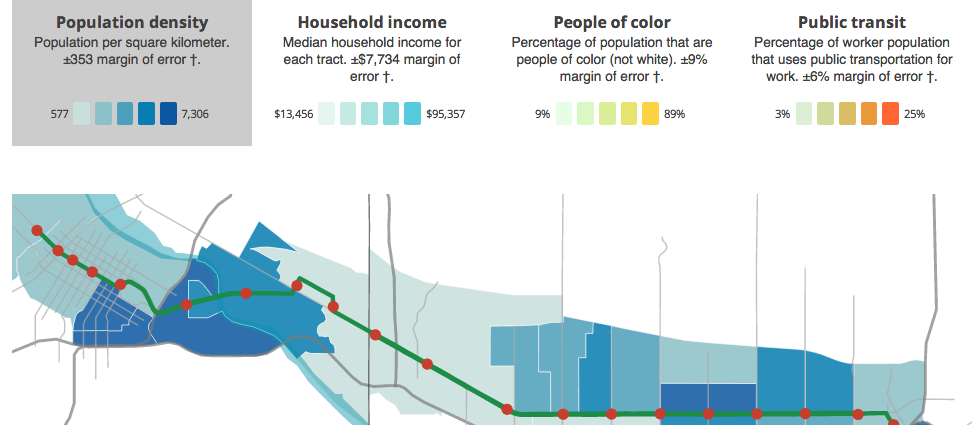
who lives on the green line
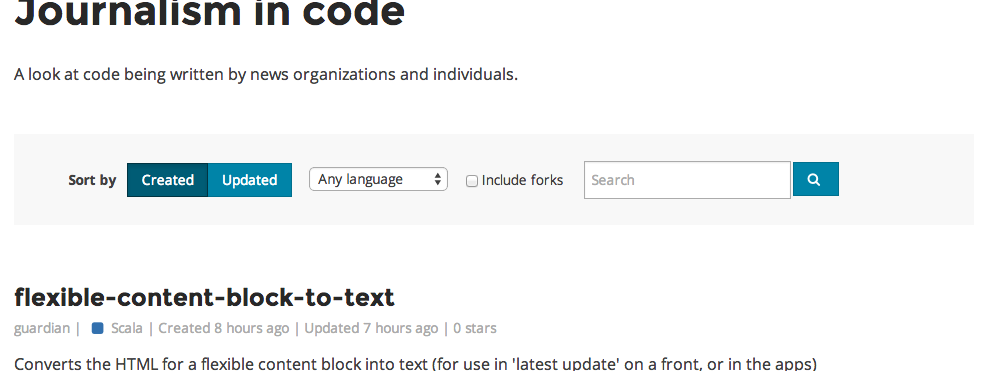
Journalism in code
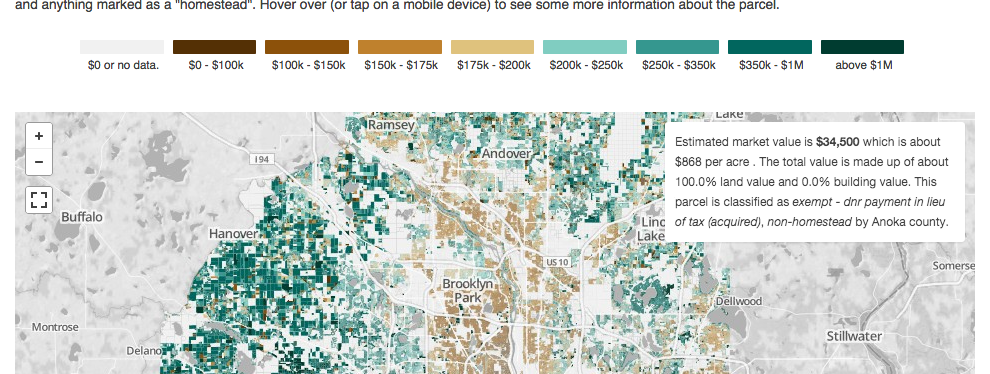
Metro-area parcels
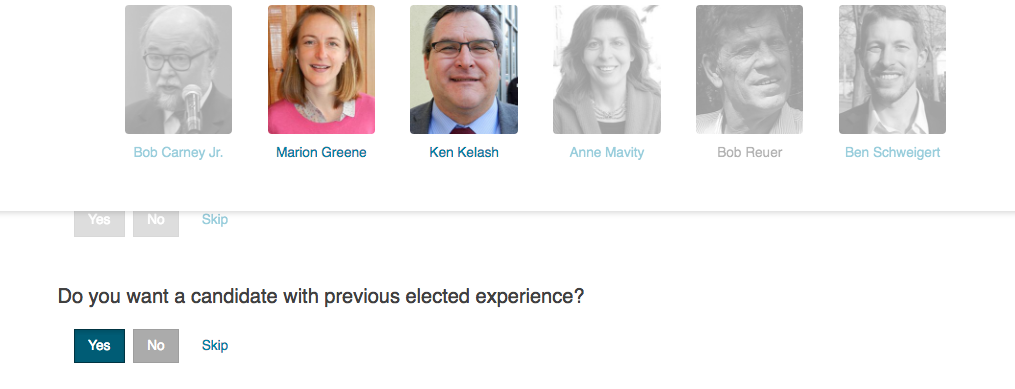
County commissioner
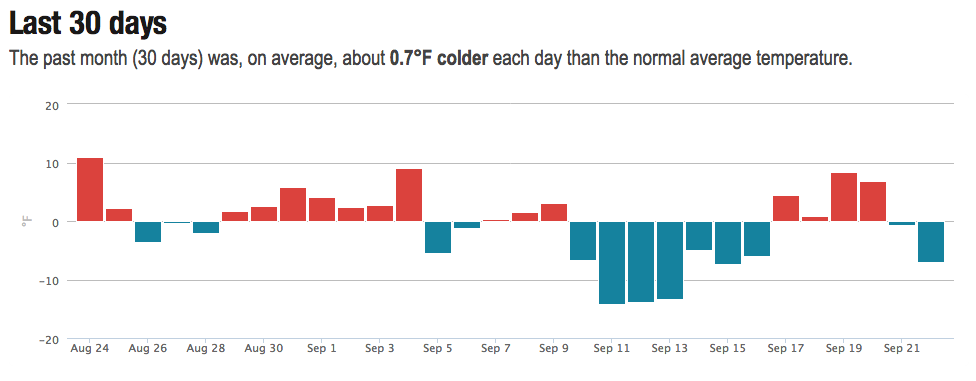
Normal temperatures
Snow emergency locator
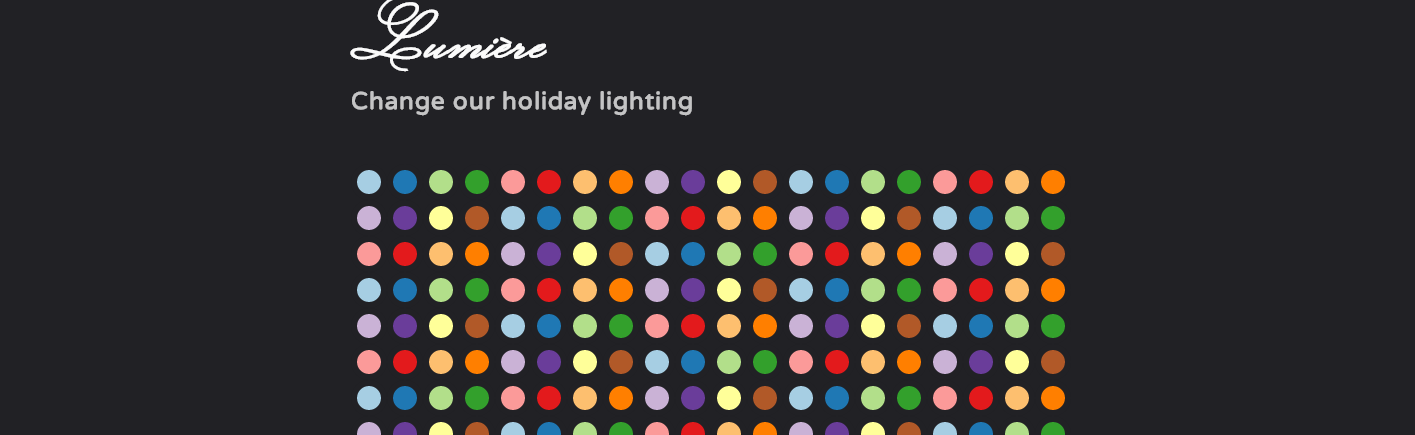
Lumière
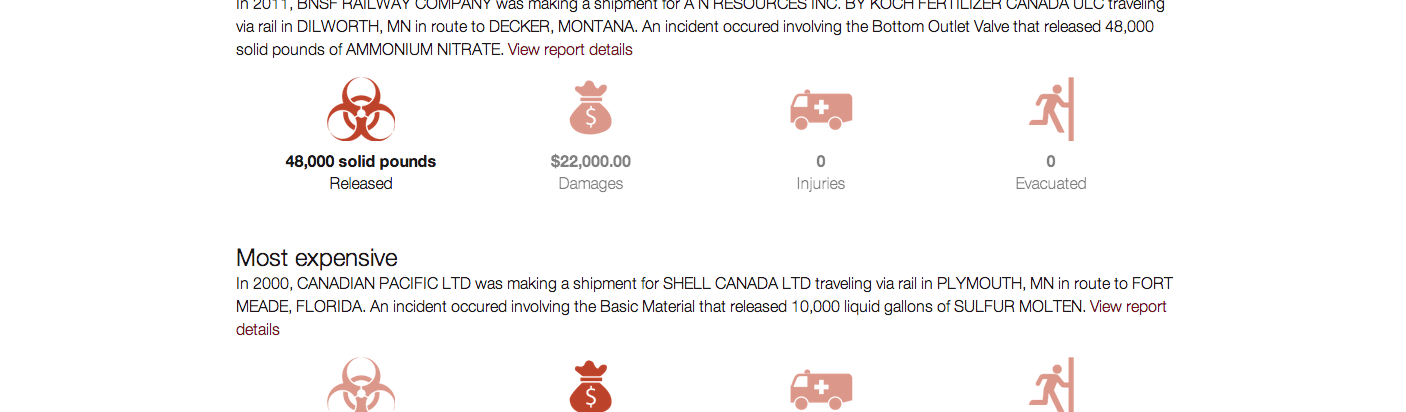
Visualizing hazardous materials
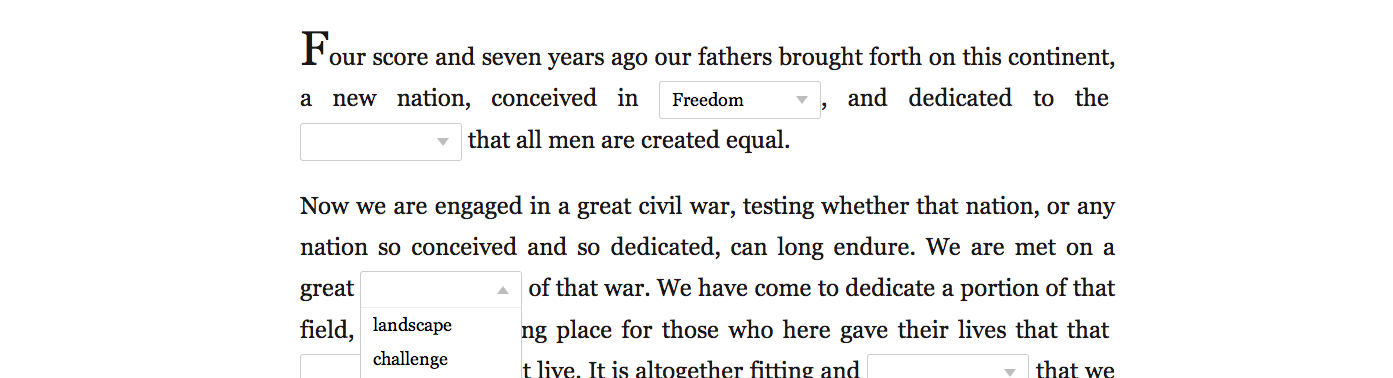
Gettysburg address
Totoro
Live elections results
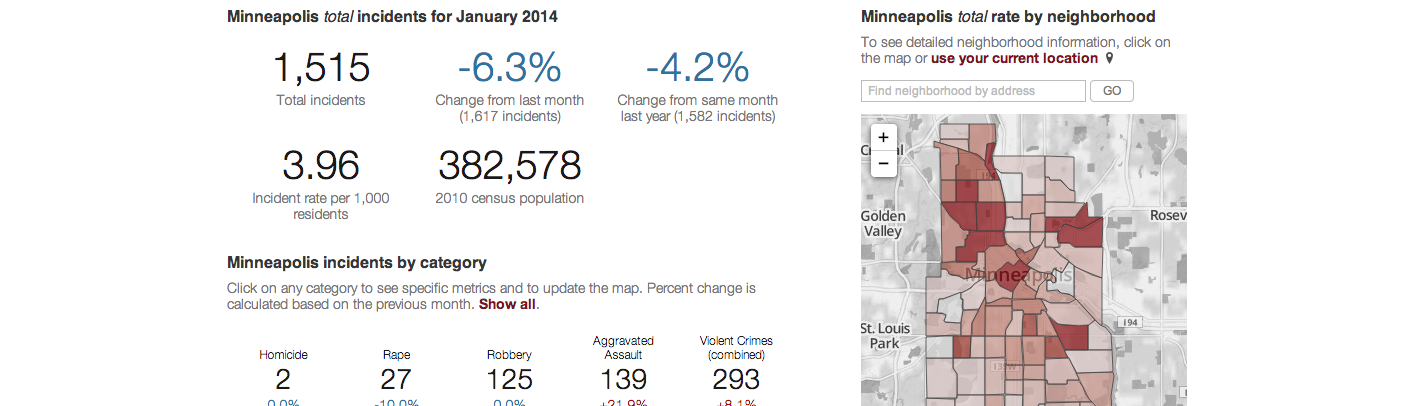
Minneapolis crime
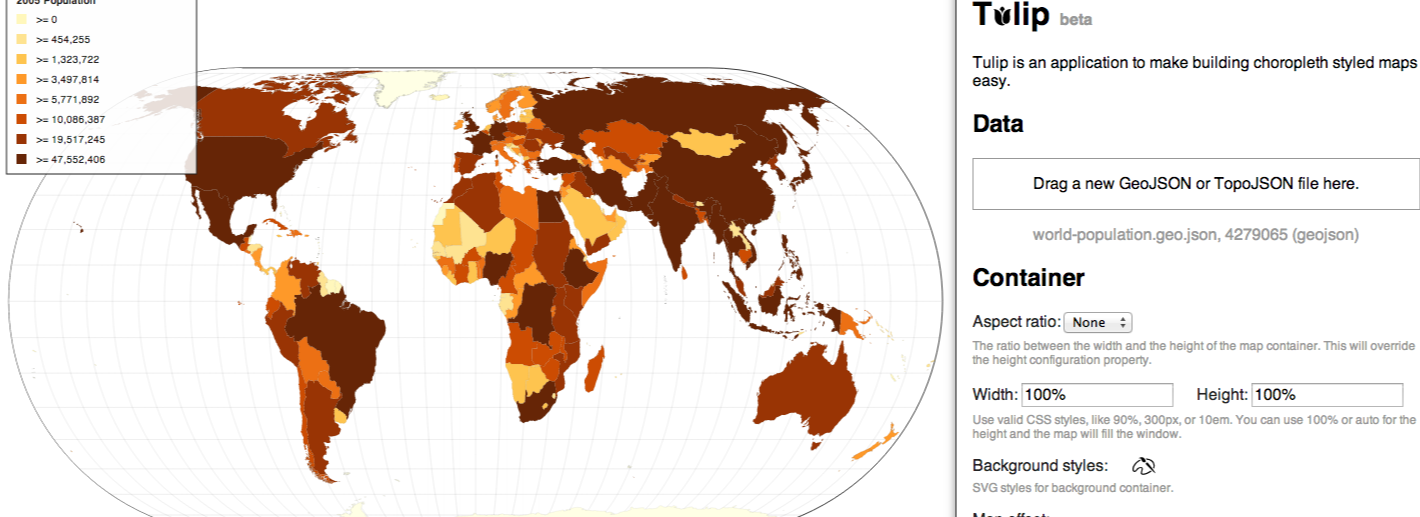
Tulip
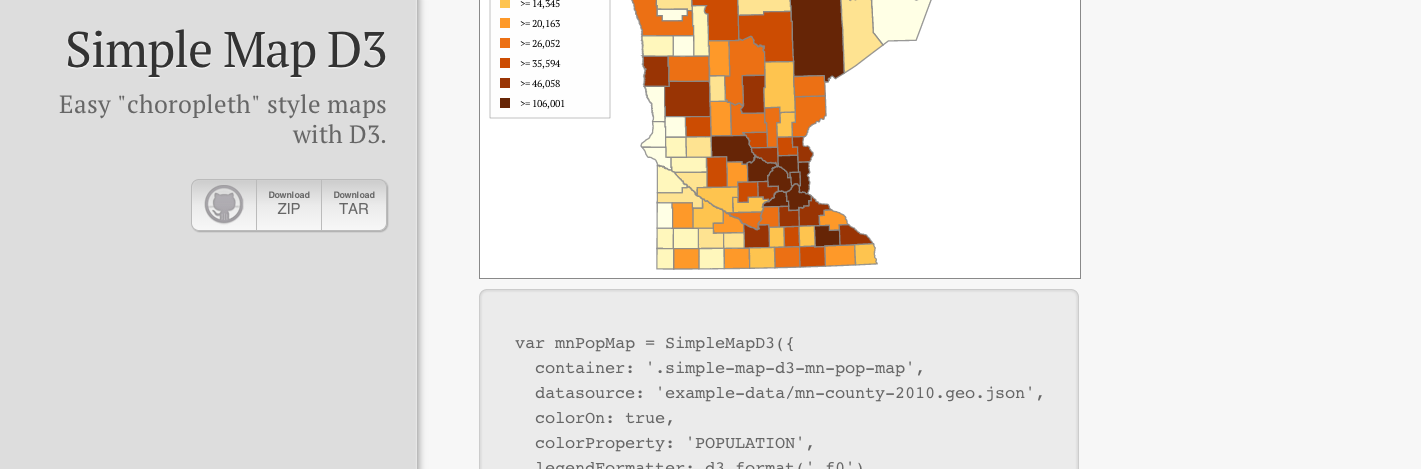
Simple Map D3
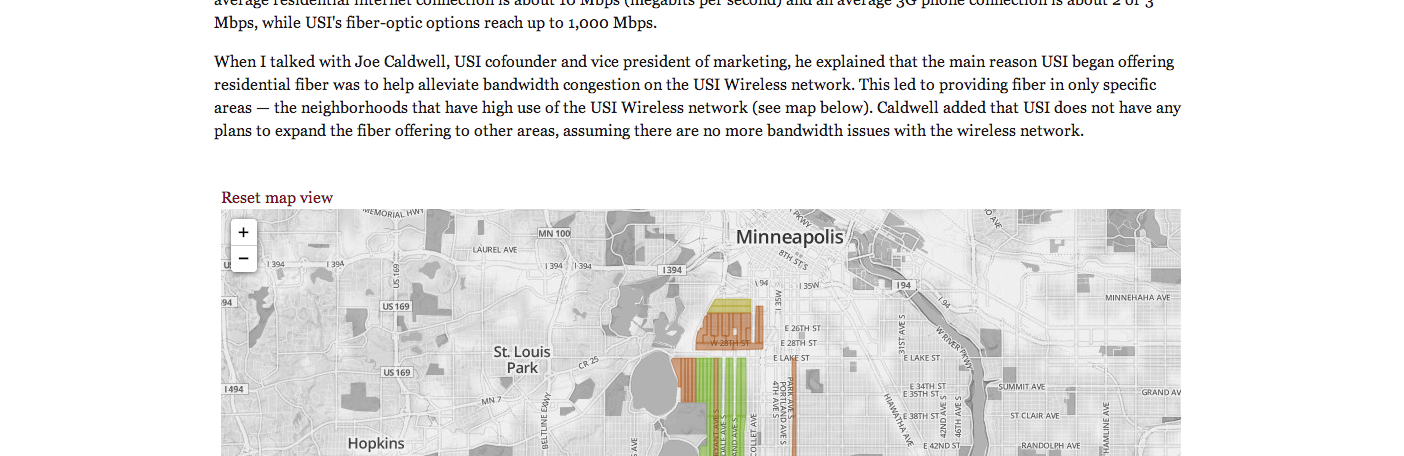
Mapping fiber
What did they pass?
Legislature tracker
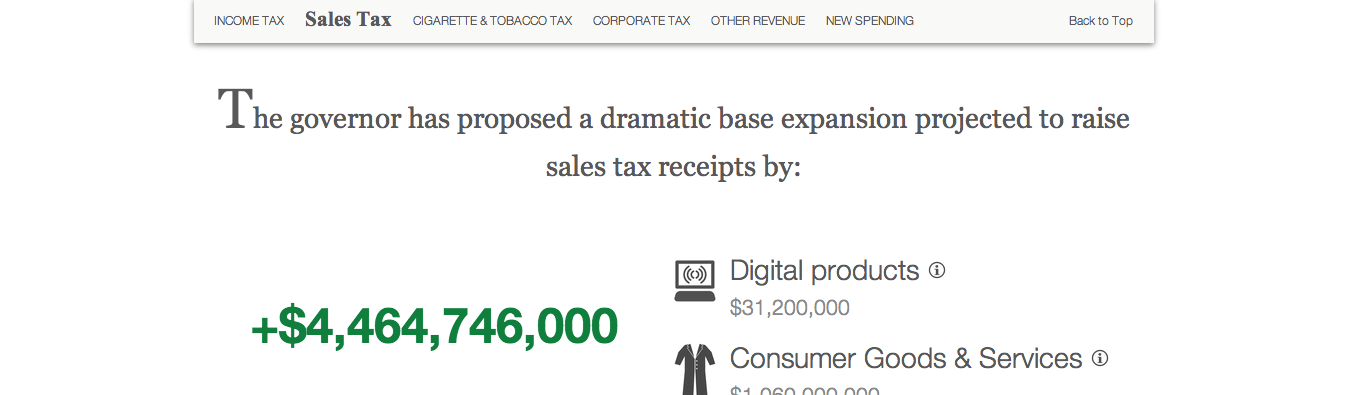
Dayton's budget
Legislature scenarios
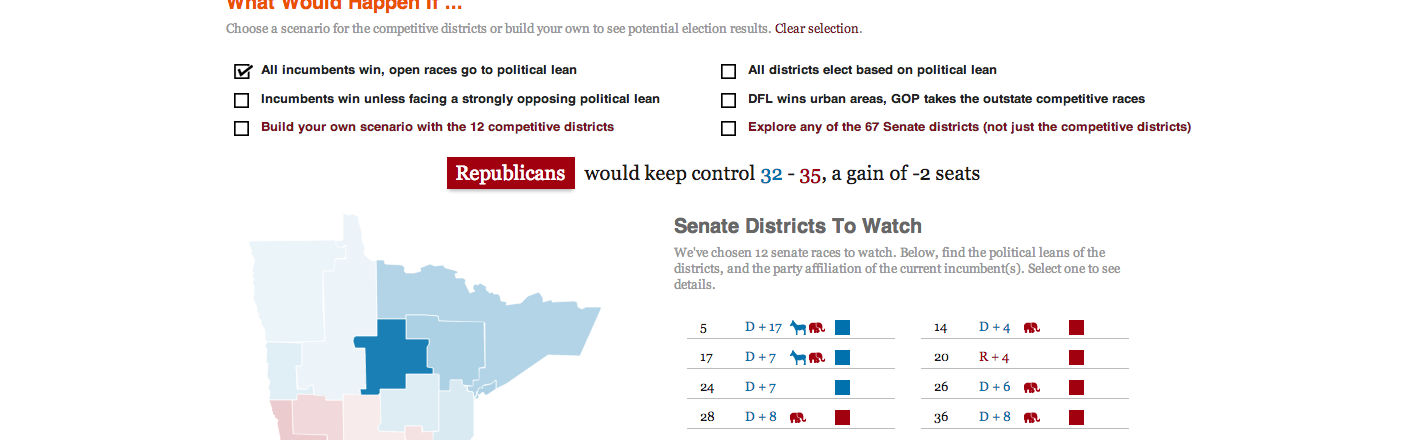
An exploration of how the Minnesota State Legislature might turn out after the election.
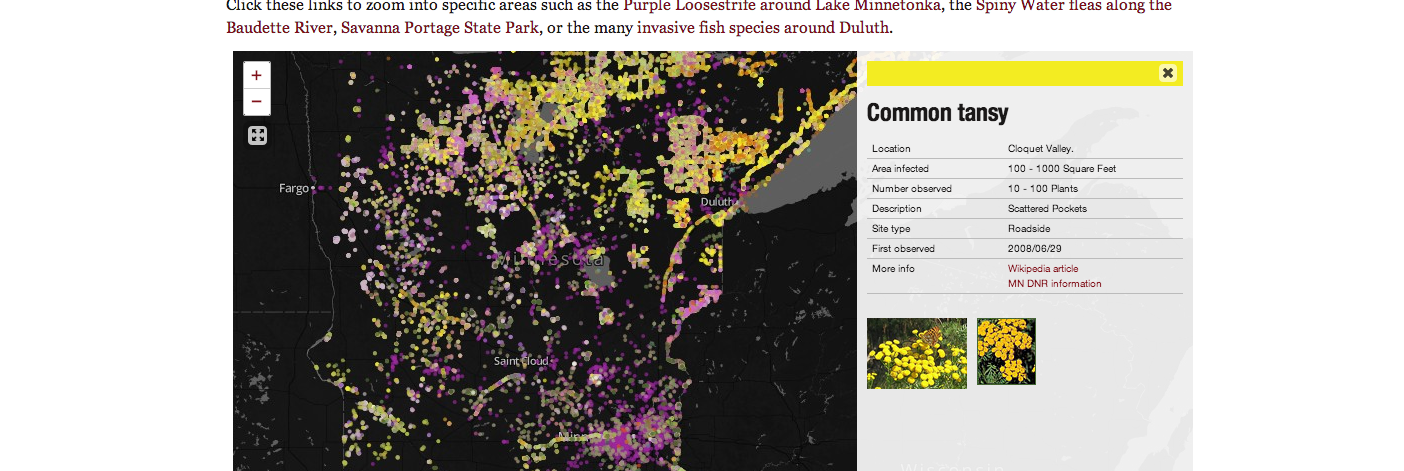
Invasive species
A Day in the Life of Nice Ride
Chronological
Change by Us (Philly)
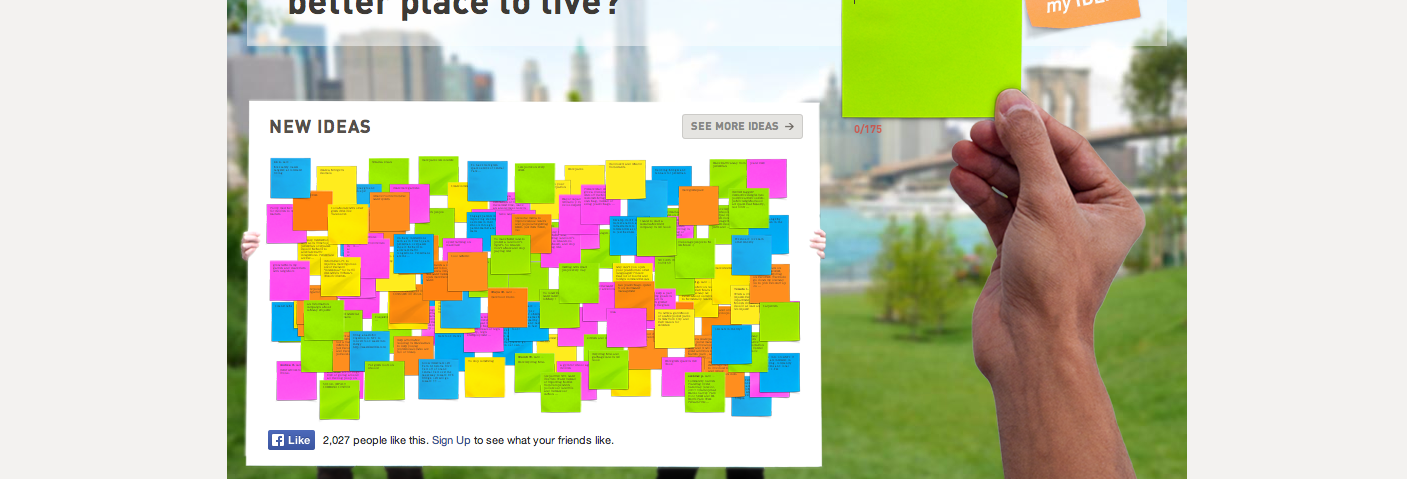
Change by Us is civic tool to gather and aggreagte feedback about community concerns.
HistoryNear.me
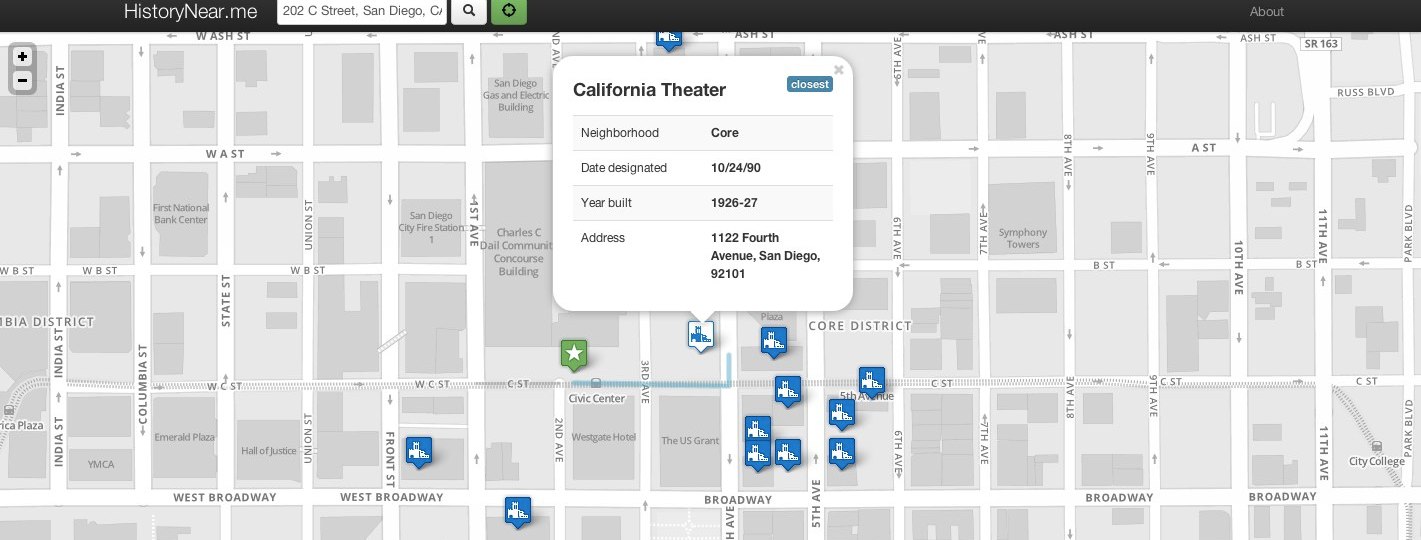
Explore historical sites in San Diego on this map.
Haiku and a Portrait
In 2009, I started the year with the thought that I would a take a self-portrait and write a haiku everyday. I did not make it more than a month, but the short time was enjoyable and I produced some decent work.